The context→answer map's per-unit-gain discounts on high-variance and template-heavy features are carried entirely by features that never fire at the context vector (HIGH confidence)
Highlight text on any card (body, plan, or an event) to anchor a comment, or leave a whole-task comment here. Mention @claude to summon a reply.
No comments yet.
Methodology: docs/methodology/issue_2163.md · gist mirror
Takeaways
- The context→answer map's per-unit-gain discounts on high-variance and template-heavy features are carried entirely by the 115,168 features that never fire at the context vector (residual-direction variance
proj_var−0.260, template-token firing sharescaffold_frac−0.236, vs a 0.009 band); among the 13,282 features that do fire, both collapse inside the 0.031 within-population band (−0.003, +0.016). The two populations are qualitatively different kinds of features: firing features are boundary/response-initiation and formatting machinery (template-token firing share rank-AUC 0.90; punctuation/formatting +13.8 pp, boundary/transition markers +13.6 pp in description categories), never-firing features token-identity-anchored content (code syntax, subword fragments) the boundary newline cannot match. - Dictionary-wide, 23 of the 24 informative feature properties predict the per-unit read beyond activity matching (max |partial Spearman| 0.239, n = 128,450; the 25th column is the matching variable itself, structurally zero), and 21 of 23 still clear the band after double frequency matching.
- Among firing features the read is graded by activity and firing shape: activity −0.220, footprint kurtosis −0.213, per-token firing frequency −0.152, and consistency sign-flipped to +0.137 all clear the 0.031 band — which survives cluster-preserving permutation stress (widened at most 2.4×, the observed maximum 2.9–7.3× outside at every decoder-similarity threshold); the dense→dense map has its own distinct profile (all 24 informative columns outside its band, variance sign-flipped to +0.12), so the discounts are map-specific.
- The per-unit read is rank-unrelated to what a feature univariately carries about the answer (Spearman −0.05 overall; 0.59 for the frequency-weighted read); 661 features are high-carried but low-read, roughly half at below-median redundancy.
- The cheap algebraic read matches the refit map's own coefficient norms at Spearman 0.285 overall, rising with activity to 0.74 by decile 8 — frequency-dependent ridge shrinkage, not an unfaithful read — and the parent-line rare-feature predictability deficit is mostly sample size (matched row counts flatten the bottom five activity deciles to 0.22–0.24).
- Coverage notes: the prefix-based arm is degenerate by construction (4 numerically indistinguishable
h_prefixvariants across 142,000 rows — capture noise, not context variation), and the conditional GPU cell never fired (d_B = 4,588, far under the 32,768 switch; realized GPU-hours 0).
Goal
- This experiment in context: The parent #1482 characterized the output side of the context→answer map in sparse-autoencoder (SAE) coordinates — which answer-side features the map can predict, and what predicts per-feature predictability. This run characterizes the input side at full 131,072-feature width: which features present at the context vector
v_C(last-prompt-token state, the newline before the assistant answer) the fitted map actually uses, separating read (coefficient influence) from carried (univariately predictive) from frequent (firing rate), then regressing the read on the mechanical covariate panel. It also runs the matched-sample-size control the parent's rare-feature gradient lacked, and a coefficient refit whose input restriction is selected by last-token activity — the one deliberate change from the parent's pooled-span coefficient arm (#779 supplied the underlying dense capture and penalty grid). - Broader narrative: Part of the context-as-vector line: feature-level interpretation of the pre-answer state is only viable if the map's use of interpretable features is predictable structure rather than bookkeeping of firing frequency. This run tests whether that program has a foothold on the input side — and finds that the answer differs sharply between features that actually occur at
v_Cand the never-firing majority of the dictionary.
Methodology
- Design: Analysis-only re-read of two banked linear maps from the last-prompt-token state on Qwen-2.5-7B-Instruct layer 19 — W: dense
v_C(3,584) → 131,072 mean-pooled SAE answer features, and M: densev_C→ dense mean-answer state (3,584) — plus a coefficient refit B: last-token SAE codes (4,588 features) → the same answer features. Nine arms: the per-feature read ladder on W and M; a univariate carried read; the B refit; an activity-stratified selection-symmetric permutation null; a row-pairing permutation null; an answer-side matched-sample-size control; two join-integrity positive controls; six map-reproduction gates. A round-2 critique revision added a tenth, zero-GPU arm: the same partial battery split by firing population. A round-3 zero-GPU check added an eleventh: cluster-preserving permutation bands that stress the within-active null against correlated decoder directions. A user-requested fire-census round (2026-08-13) added a twelfth, zero-GPU arm: descriptive characterization of the firing vs never-firing populations — per-covariate rank-AUC contrasts plus an answer-side description-category census with label-shuffle bands. No training, no generation, no LLM judging; one deterministic seed (2163) for the run's permutation draws. The prefix-based mapping arm is a stated deviation:h_prefixtakes exactly 4 distinct float-vector values across all 142,000 rows (258 rows deviate from the reference, minimum cosine 0.99989, uniform prefix end position 23) — capture-time numerical noise rather than context-driven variation, so a prefix-based map has no cross-context variance to fit; a multi-turn corpus is the named follow-up route. An earlier claim that the prefix state was exactly constant (one distinct row) was falsified at full grain and corrected before any analysis code ran; the 4-variant measurement above is the corrected record. - Training: N/A — no model training.
- Evaluation: Per feature j with decoder column
d_j:U_j= per-unit-activation influence of j through the map (the norm of the standardized decoder direction pushed through the ridge coefficients — frequency-free);A_j= exact ablation change in held-out R² from deleting j's rank-1 term (20,000 holdout rows, cross-term unclipped, so negative values are possible);C_j= mean squared prediction change per active holdout row over pooled target variance;Carried_j= held-out R² of the univariate predictor built from j's activation alone;‖B[j]‖= row norm of the refit coefficients. Headline statistic: the activity-matched partial Spearman between each of the 25 selection columns (22 varying covariate-panel floats after dropping the constantdec_norm, plus 3 last-token columns) andlog U_j, with the observed max-|partial| compared against the 97.5% quantile of per-draw maxima from a 1,000-draw activity-decile-stratified permutation of the DV — each draw recomputes all 25 partials and takes the same max, so observed and null get identical selection. The partial statistic is bounded by 1, leaving a band-to-ceiling margin of 0.991 — the test is informative by construction. Matching variable:lasttoken_count; a robustness pass addsfiring_freq_per_tokenas a second matching variable, and those double-matched partials are read against the single-matched band (no double-matched draw matrix was banked).proj_varcomes from a multi-turn corpus, which attenuates but cannot manufacture its row. The round-2 population split recomputes all 25 partials separately within the train-active and never-active populations under the identical convention, each against a fresh 1,000-draw band over its own rows (scripts/issue2163_population_partials.py, which imports the driver's rank/residualize/partial functions; independent seed stream 2215); its full-pool leg reproduces every committed informative partial to 1.1e-16 before the restricted reads are used. The round-3 check (scripts/issue2163_cluster_null.py, keyed seed stream (2163, 53)) groups the 13,282 within-active features into connected components of decoder-column cosine at nine thresholds (0.30–0.90) and re-draws the same 1,000-draw max-over-columns band with each cluster moved as an intact block, under two schemes: cluster-blocked concatenation (a Mantel-style variance-inflation stress in the conservative direction) and whole-block exchange among same-size clusters, whose per-threshold frozen-feature fraction is reported (0.490 at threshold 0.30, where the giant component's stratum size is unique so it never moves). The check imports the driver's rank/residualize/partial functions, reproduces every committed within-active partial exactly (maximum absolute difference 0.0), and its all-singleton reduction reproduces the committed band within Monte-Carlo error (relative difference 2.6% at 1,000 draws). Never-active features are excluded from this check: their pairwise cosine matrix would be ~53 GB (over the 50 GB off-VM routing gate), and matching is inert there (tie fraction 1.000), so that band already degenerates to a plain permutation that cluster stratification cannot change. Two positive controls gate any frequency-only narration and both pass: raw Spearman ofA_jvs last-token activity +0.390 (threshold +0.3) and activity vslasttoken_count+0.290 (threshold +0.2). The row-pairing null (200 draws) permutes the holdout pairing between firings and residuals for the ablation read. The fire-census arm (scripts/issue2163_fire_census.py, seed 2163) rebuilds the population split exactly (128,450 / 13,282 / 115,168 reproduced againstpopulation_partials.json), computes per-covariate rank-AUC = P(firing > never-firing) with median [IQR] per population, and applies a 15-category non-exclusive keyword taxonomy to the banked answer-side auto-interp description bank (recovery_1934 merge: 127,802 rows, 197 out-of-range ids dropped → 127,605 valid; join coverage 99.4% firing / 99.3% never-firing, so coverage cannot explain any contrast; 8.8% of labeled features match no category), reading category-share differences against per-category and family-wide max-based 1,000-draw label-shuffle bands; the 1,653 context-side-labeled features (the parent line's context-side describe run — a different instrument, never pooled with the answer-side taxonomy) are reported separately, all outside the complete-case pool with only 7 firing pre-mask. The answer-side taxonomy is a semantic-identity proxy for populations defined at a context position — an evidence-side caveat carried by every category read. SAE reconstruction ofv_Con holdout has fraction of variance explained 0.718 (residual share 0.282), inherited by the algebraic reads; the refit arm is reconstruction-free. Held-out reads carry a corpus fold (10,983 LMSYS / 9,017 WildChat holdout rows, joined through the banked provenance labels with zero sentinel hits). Reproduction gates: re-materialized W selected the banked penalty (grid index 13) with pooled panel R² matching the banked value to 10 decimals and max per-feature |ΔR²| 2.978e-08 (tolerance 5e-3); M matched its banked held-out R² and penalty; the identity-plus-learned-bias baseline for M reproduced at −1.023. Analysis constants:
| Parameter | Value | Source |
|---|---|---|
| Model / layer | Qwen-2.5-7B-Instruct, layer 19 residual stream | banked capture (dense_targets_meta.json, field cx_last@L19) |
| SAE | andyrdt/saes-qwen2.5-7b-instruct rev c37e53c4bb…, resid_post_layer_19, BatchTopK k=64, dictionary 131,072 | parent pin, loaded at the same revision |
| Panel / splits | 142,000 contexts; 120,000 fit / 2,000 validation / 20,000 holdout, sha-pinned row order | banked inputs/{which,order}.npy |
| Ridge penalty grid | logspace(-3, 8, 23), selected on the validation carve (no generalized cross-validation) | banked cell configs |
| Selected penalties | W: 3162.2776601683795 (grid idx 13); M: 1000.0; B: 3162.2776601683795 | repro_gates.json, confirm_B.json |
| Refit restriction | last-token active count ≥ 20 train rows, cap 49,152; realized d_B = 4,588 (n_train/d = 26.2); excluded features carry 1.0% of active mass | census.json, confirm_B.json |
| Null draws | 1,000 (stratified permutation, per-DV); 200 (row-pairing); 1,000 per population (round 2, seed stream 2215); 1,000 per scheme-threshold cell (round 3 cluster null, seed stream 2163/53) | nulls/*.npz, population_partials.json, cluster_null.json |
| Retrieval read | 5,000 probes vs 20,000-row holdout pool; chance at rank 1 = 5e-05 | knn_baselines.json |
| Seed / software | 2163; numpy 2.2.6, scipy 1.17.1, torch 2.8.0 | run metadata in every result JSON |
- Data extraction: The panel is 142,000 real single-turn conversations sampled from LMSYS-Chat and WildChat (realism tier 1: real user text), inherited unchanged. Its production: dense residual-stream states were captured at layer 19 at the last prompt token (the newline of the assistant header) for every context, alongside mean-pooled answer states over the model's answer tokens; per-token SAE codes from the public BatchTopK dictionary above were reduced to pooled-span and last-token blocks and stored as a 1,920-shard sparse store; a per-feature covariate panel (activity, consistency, encoder/decoder geometry, logit-footprint statistics, template-token share, redundancy, projection variance) was computed from that store plus decoder geometry. This run streams the store once to build the last-token feature-by-context matrix (142,000 × 131,072, ~33 active features per row, 4,700,819 stored values; every row has at least one code; 13,765 features ever fire at the last prompt token, 13,289 in the training split), re-materializes W and M from the banked inputs under the parity gates above, and computes every read in closed form — no per-feature fits. The three last-token covariates (
lasttoken_count,mean_act_when_active_lasttoken,span_last_ratio) are computed here from the training split. Complete-case features for the partials: 128,450 of 131,072 — partitioned in round 2 into 13,282 train-active plus 115,168 never-active at the last prompt token. - Sample training/evaluation data + completions: No model completions were generated anywhere in this task (zero sampling, zero judge calls); the analysis consumes banked activation tensors, so the sample below is numeric ladder rows rather than text. Disclosure: 5 of 131,072 per-feature ladder rows, random sample (seed 42); full artifact: read_ladder__W.npz on HF.
| feature id | U_j | A_j | C_j | carried | last-token count (train) | holdout count |
|---|---|---|---|---|---|---|
| 11697 | 0.2287 | 0.0 | 0.0 | undefined | 0 | 0 |
| 56756 | 0.2024 | 0.0 | 0.0 | undefined | 0 | 0 |
| 57524 | 0.2655 | 0.0 | 0.0 | undefined | 0 | 0 |
| 85794 | 0.2105 | 0.0 | 0.0 | undefined | 0 | 0 |
| 101441 | 0.2394 | 0.0 | 0.0 | undefined | 0 | 0 |
All five randomly drawn features never fire at the last prompt token — the expected shape, since 117,783 of 131,072 features (90%) have zero last-token activations in training. U_j is still defined for them (it is a property of the map, not of the data), while A_j is exactly zero for the 122,529 features inactive on holdout and Carried_j is undefined off the 13,289 train-active features. I acknowledge the check-20 WARNs this body ships: several Takeaways bullets exceed the 30-word soft cap, several per-result blocks exceed the 120-word soft cap, a few result paragraphs run to four sentences, and the Takeaways-plus-Goal-plus-Results total exceeds the 800-word budget — the overage carries the multi-arm coverage the plan requires. I also acknowledge that the partials forest figures render covariate column slugs (e.g. enc_dec_cos, span_last_ratio) as their axis labels; these are the covariate panel's column names, glossed in prose wherever a claim rests on them.
Results
The per-unit read is structured dictionary-wide: 23 of 24 informative properties predict it beyond activity matching
Each bar is the activity-matched partial Spearman between one of 25 feature properties and the log per-unit read on the dense-to-SAE map (n = 128,450 features); dashed lines mark the 97.5% max-over-columns permutation band. The companion scatter shows raw per-feature read strength against last-token active count.
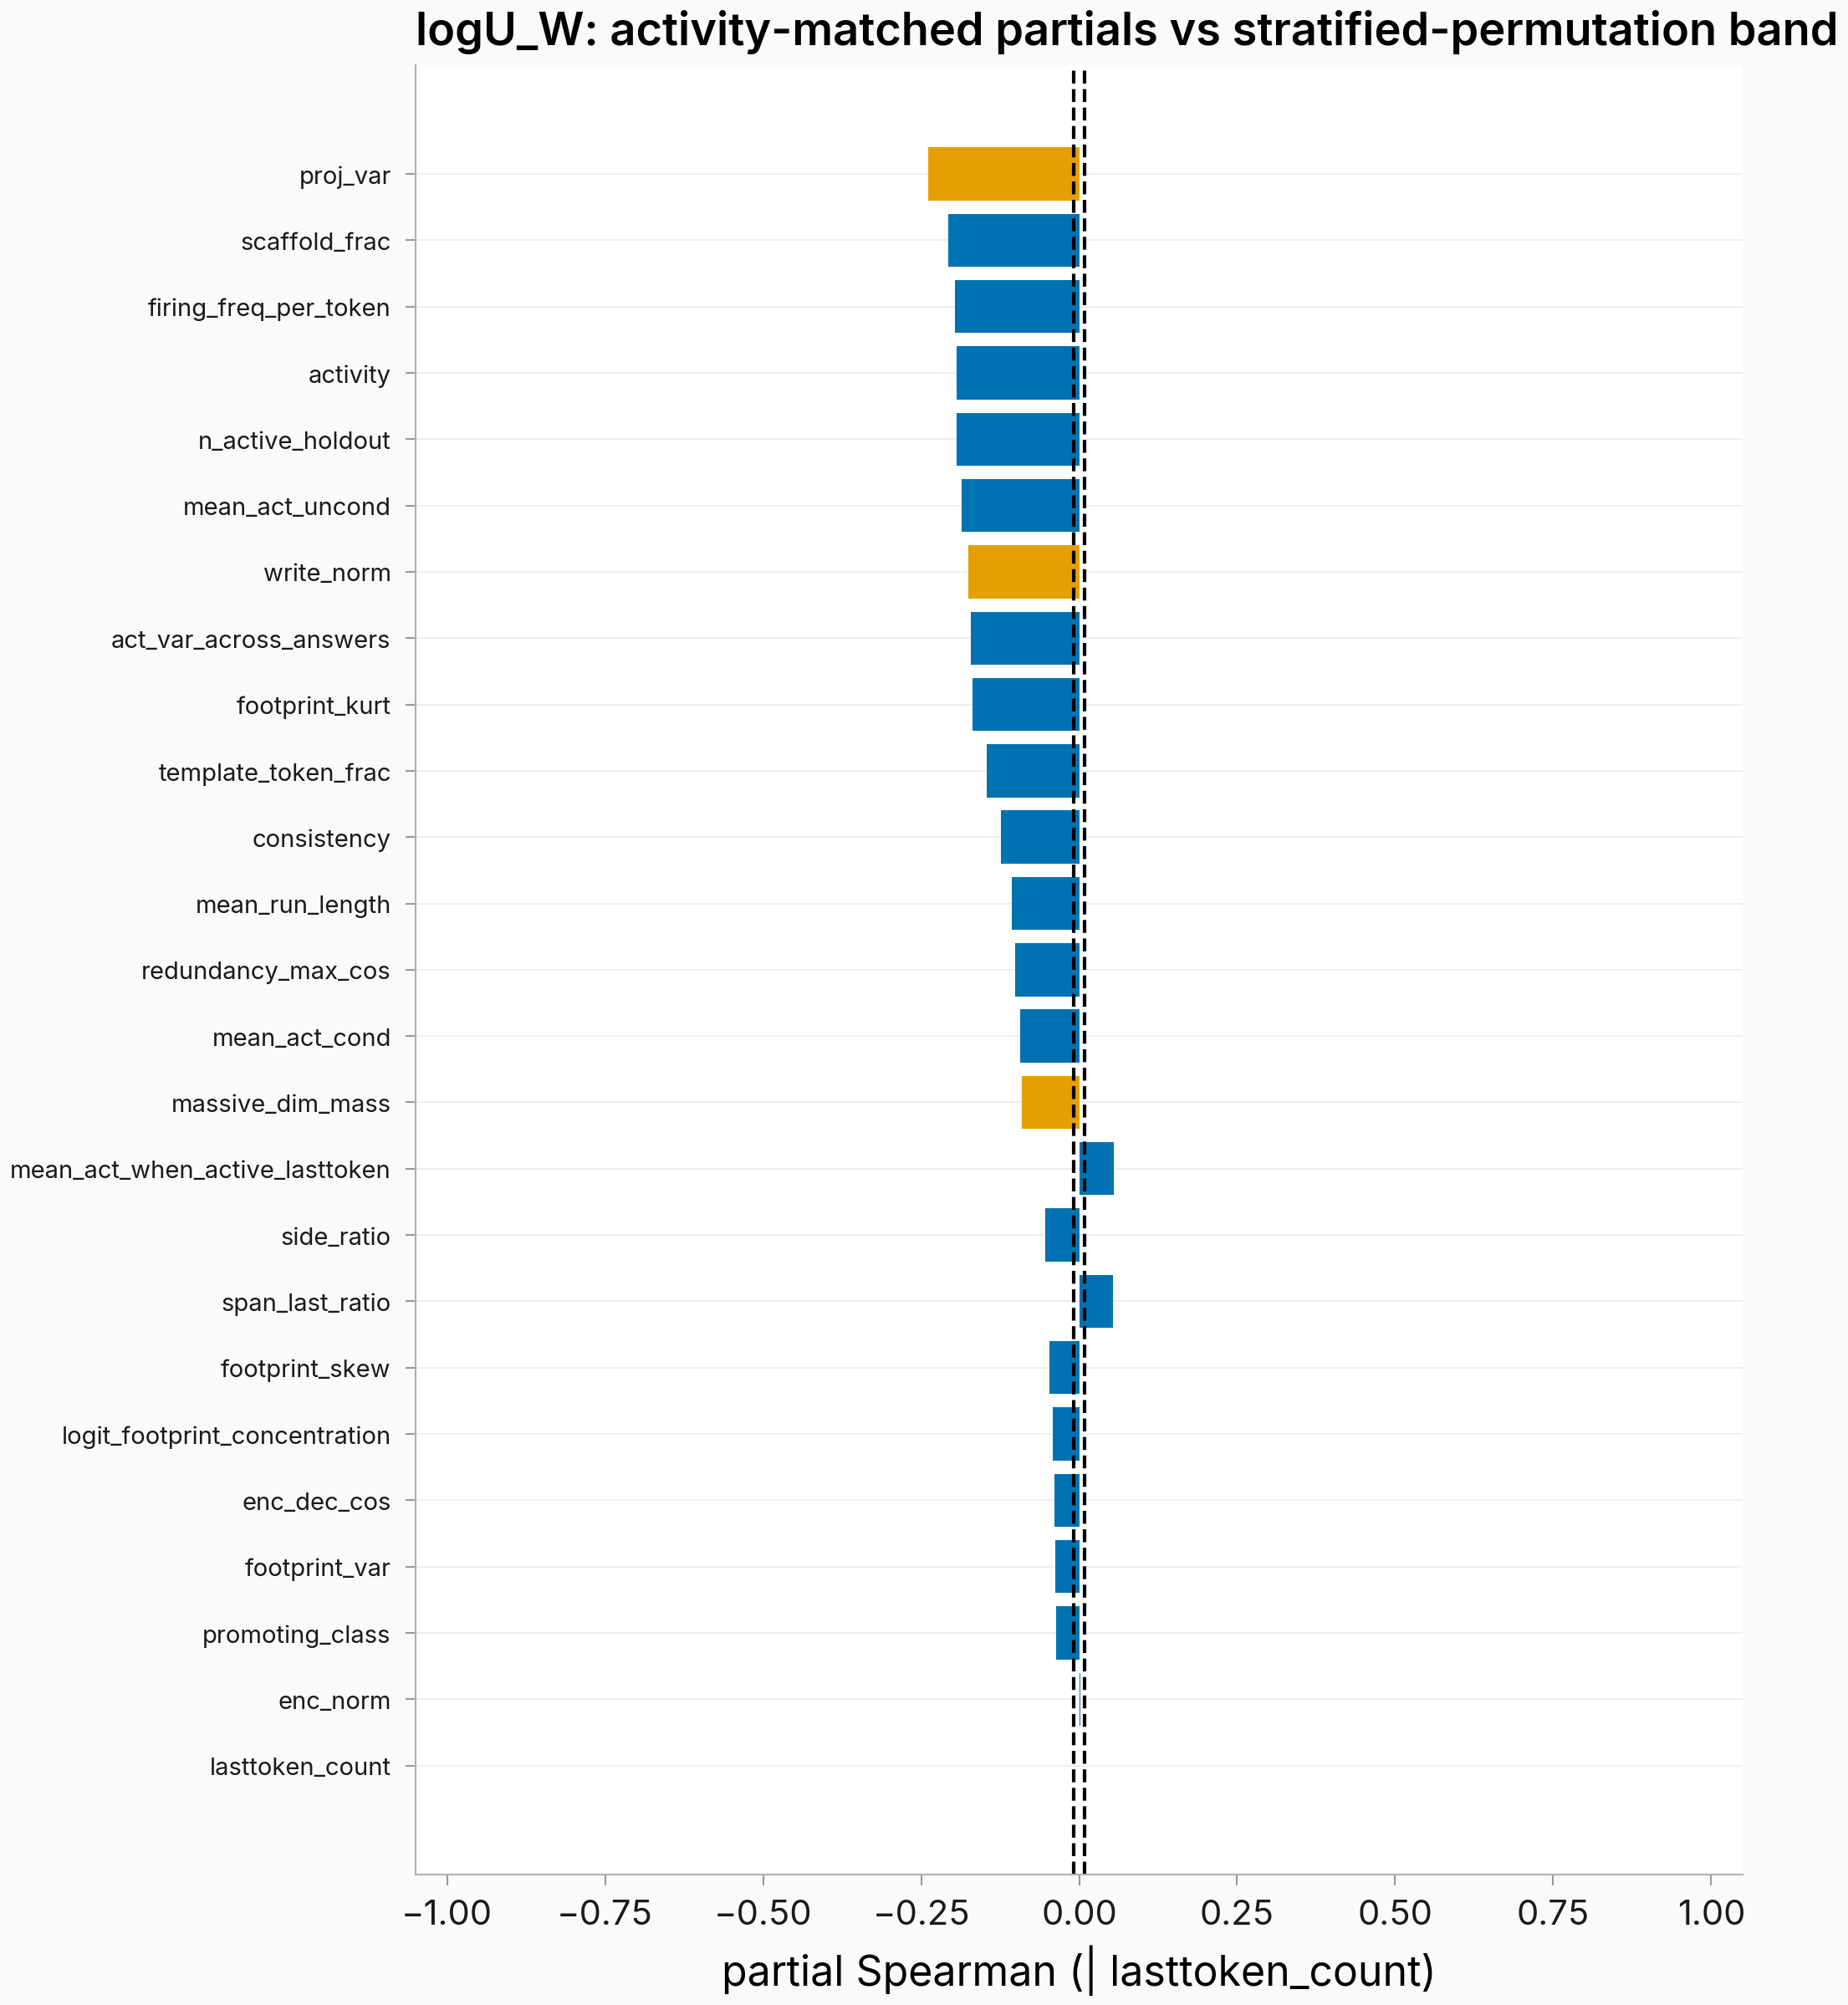
Figure. Nearly every mechanical property predicts the per-unit read, and every strong predictor is negative. Activity-matched partial Spearman per property vs
log U_j, n = 128,450; dashed lines: 97.5% band of the per-draw max over the same 25 columns (1,000 stratified permutations). Orange: geometry-coupled columns. The raw per-unit companion scatter follows.
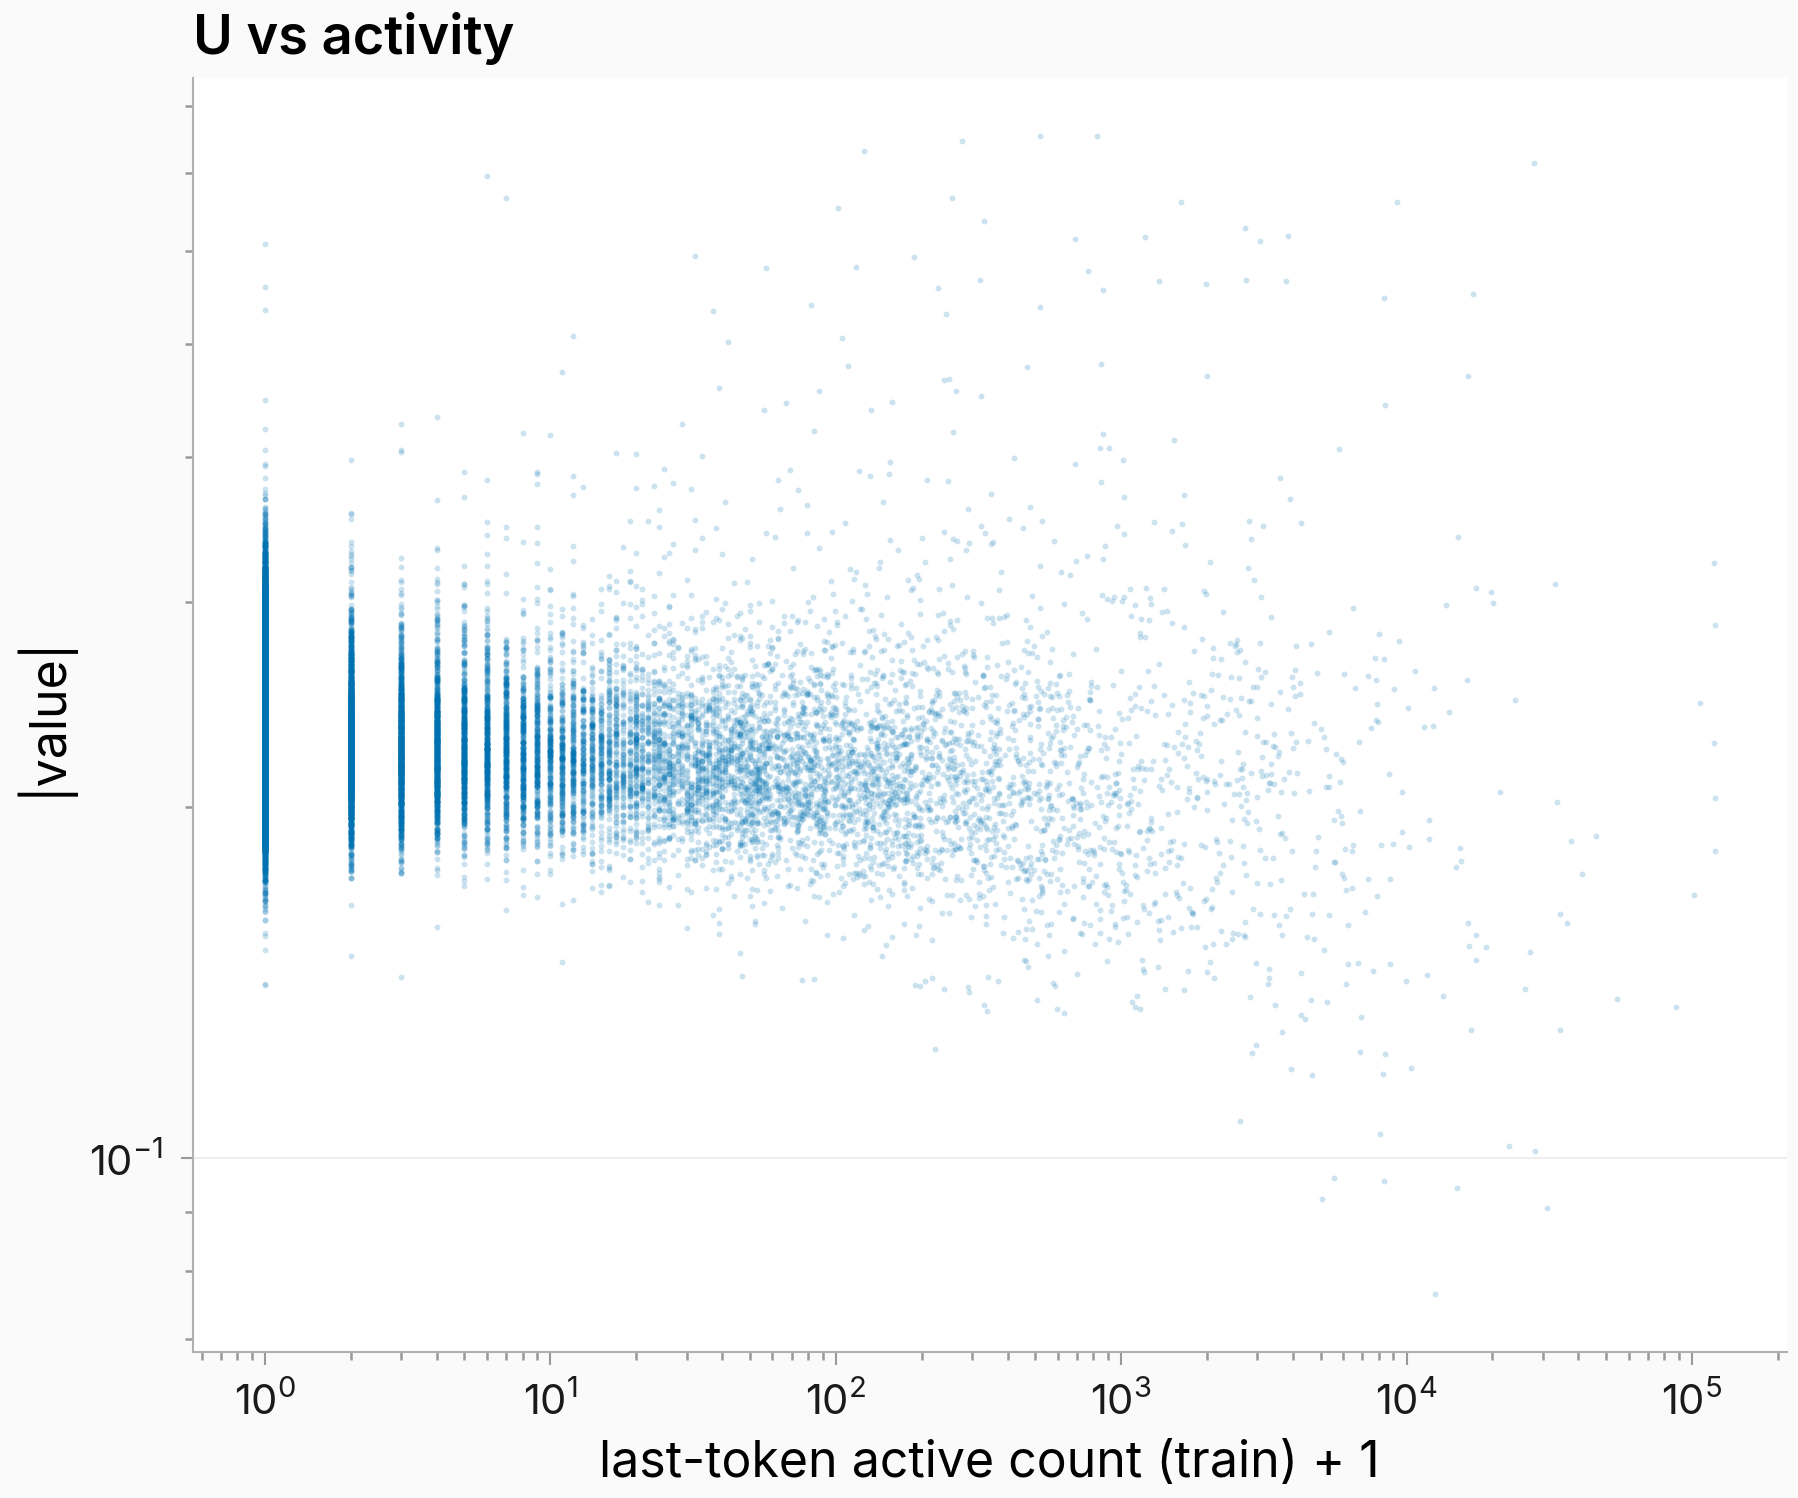
Figure. Raw companion view. |U_j| (log) vs last-token active count + 1 (log), one point per feature; the mild downward envelope is the raw signal the matched partials isolate.
The top partial, proj_var (residual-state variance along the decoder direction), reaches −0.239 against the 0.009 band; 23 of the 24 informative properties clear it (the 25th is the matching variable, structurally zero). After double frequency matching, 21 of 23 informative columns still clear, led by proj_var (−0.19), scaffold_frac (−0.18), and write_norm (−0.13). The dense→dense map's profile differs — all 24 informative columns outside its band (same structurally-zero matching column), mean firing-run length +0.25 on top, template-token fraction and proj_var sign-flipped to +0.17 and +0.12 — so the discounts are map-specific. Features the parent map predicts better on the answer side get a lower per-unit read (−0.125 vs its 0.006 band, kept outside the selection max).
The variance and template discounts come from never-firing features; firing features show an activity-graded read
Paired bars: the same activity-matched partials computed separately within the 13,282 train-active and 115,168 never-active features (a complete-case partition of the pool above), each against its own 1,000-draw permutation band (dashed, color-matched). The companion scatter shows per-unit read against residual-direction variance, colored by population.
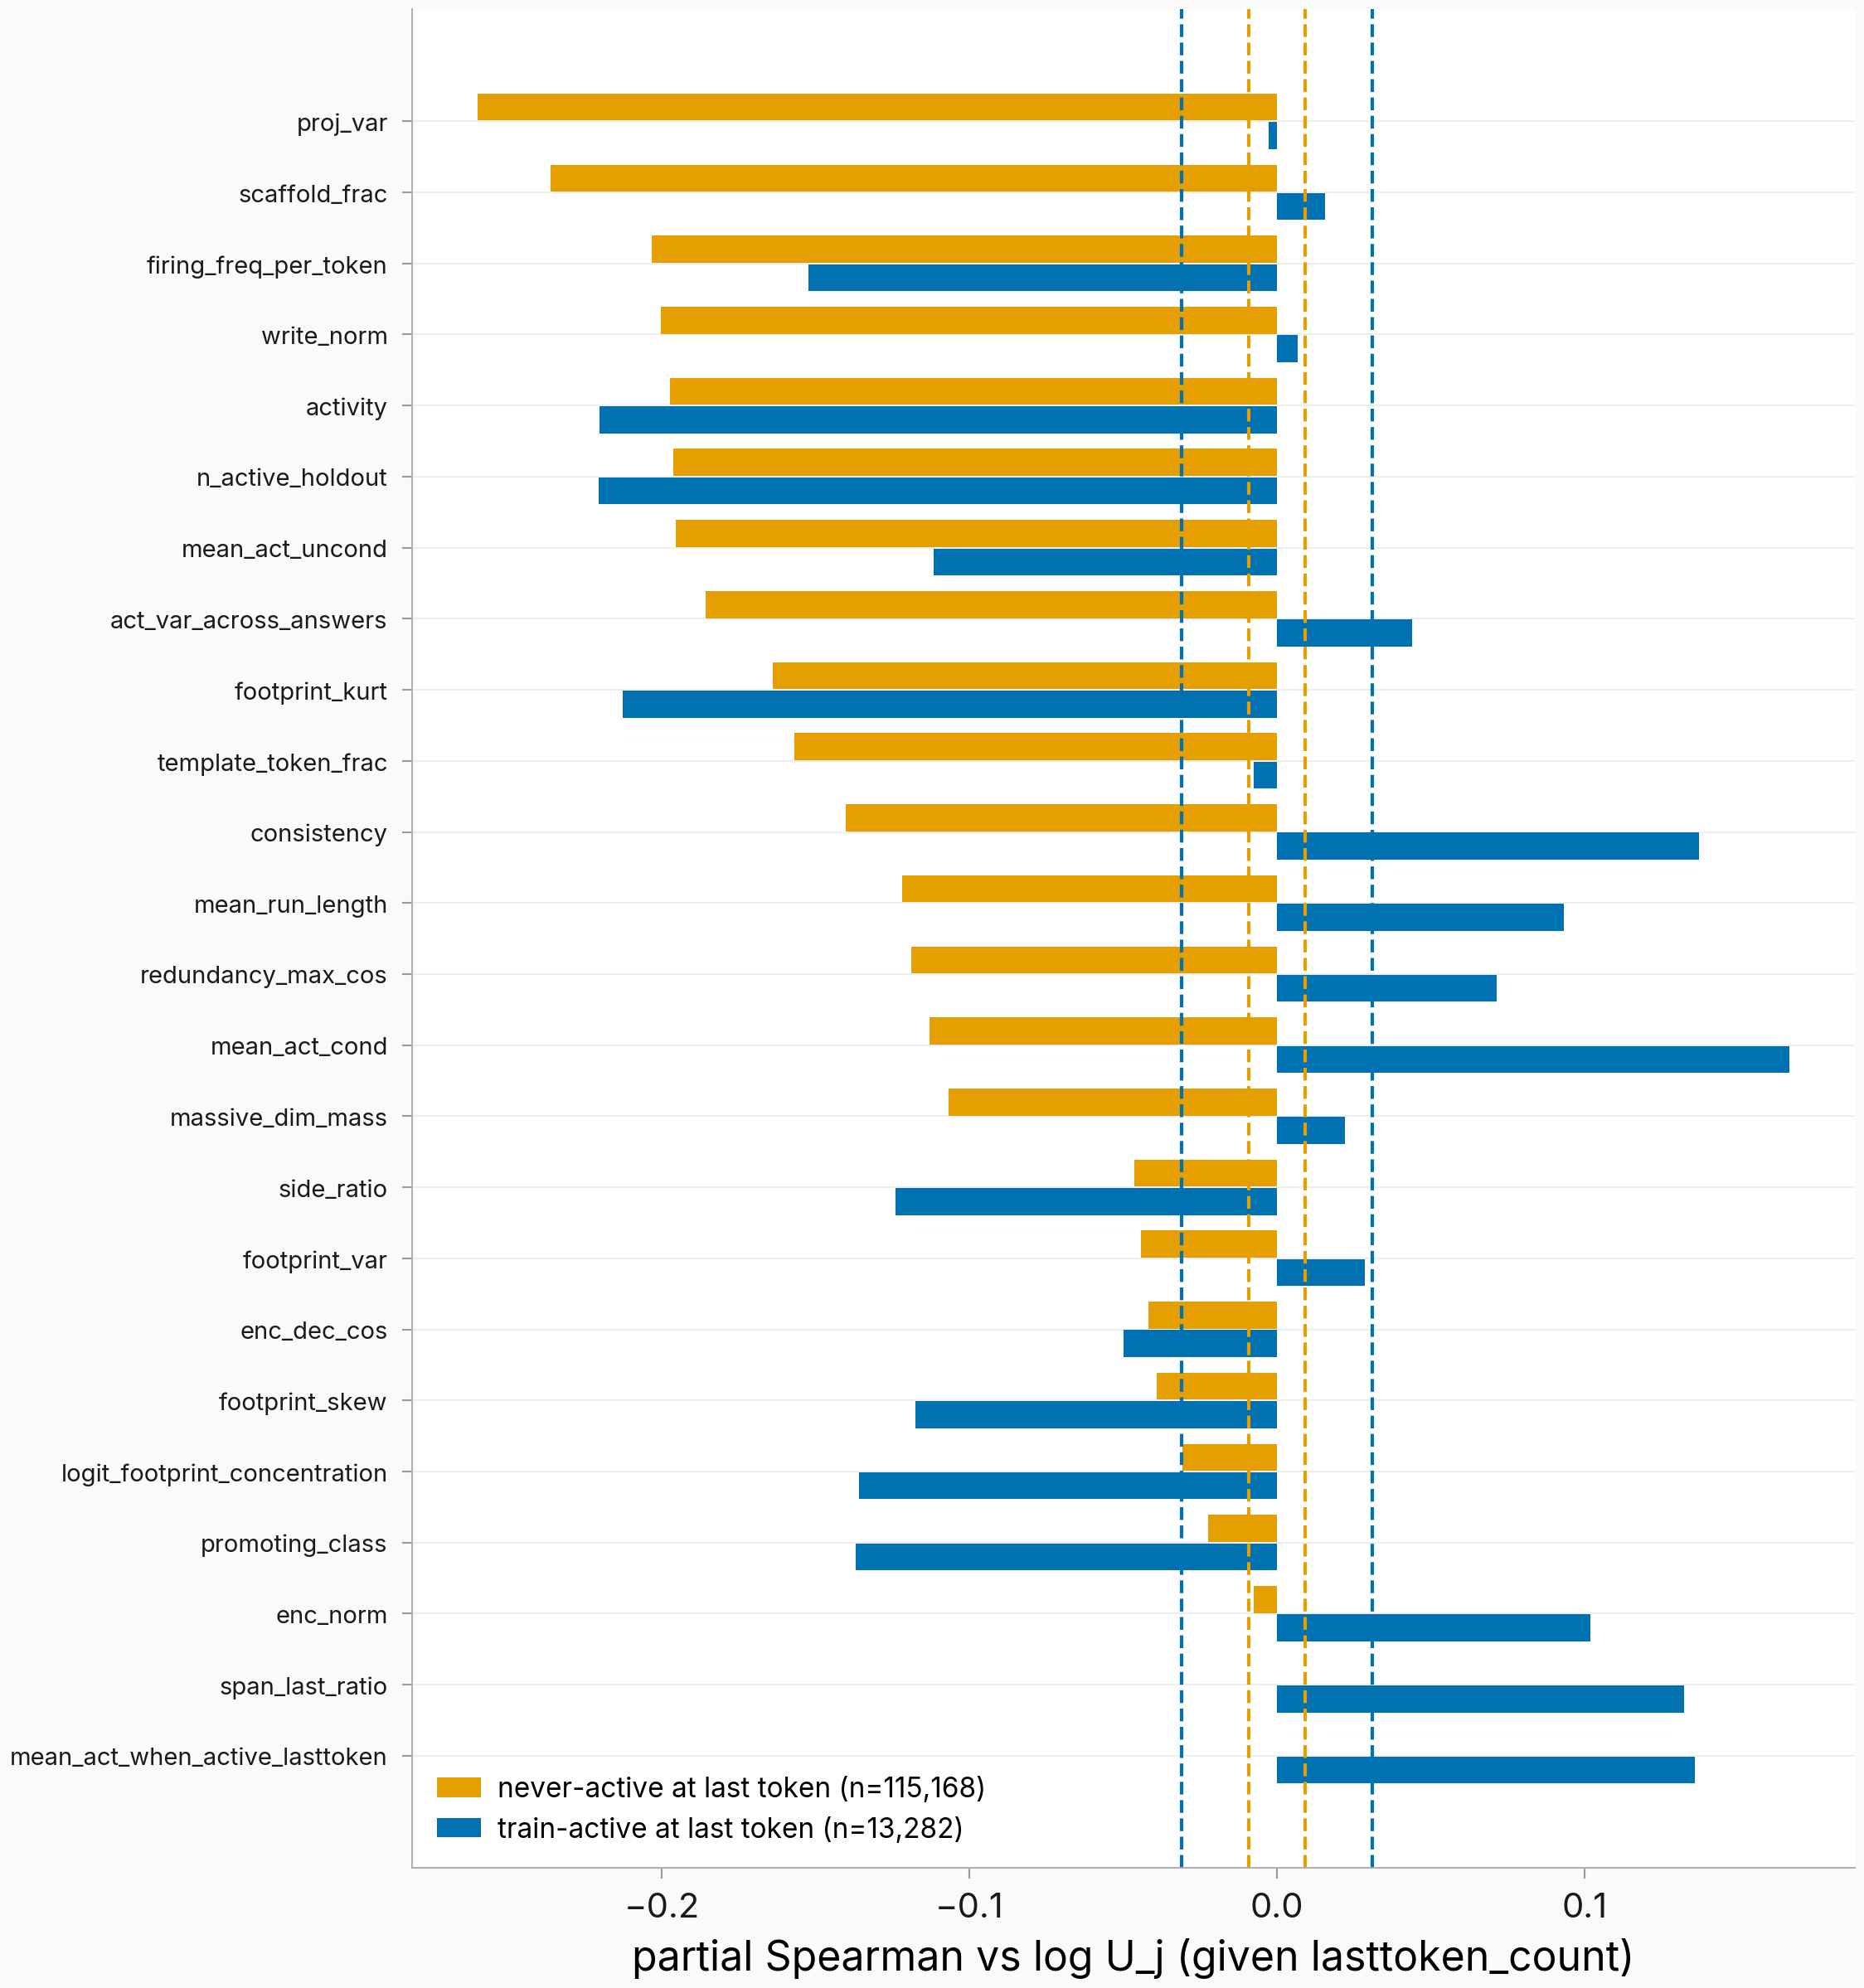
Figure. The headline discounts vanish among features present at the context vector. Activity-matched partial Spearman vs
log U_jper population; dashed lines: each population's own 97.5% max-over-columns band (0.031 train-active, 0.009 never-active). The full-pool leg of this recompute reproduces the committed partials to 1.1e-16.
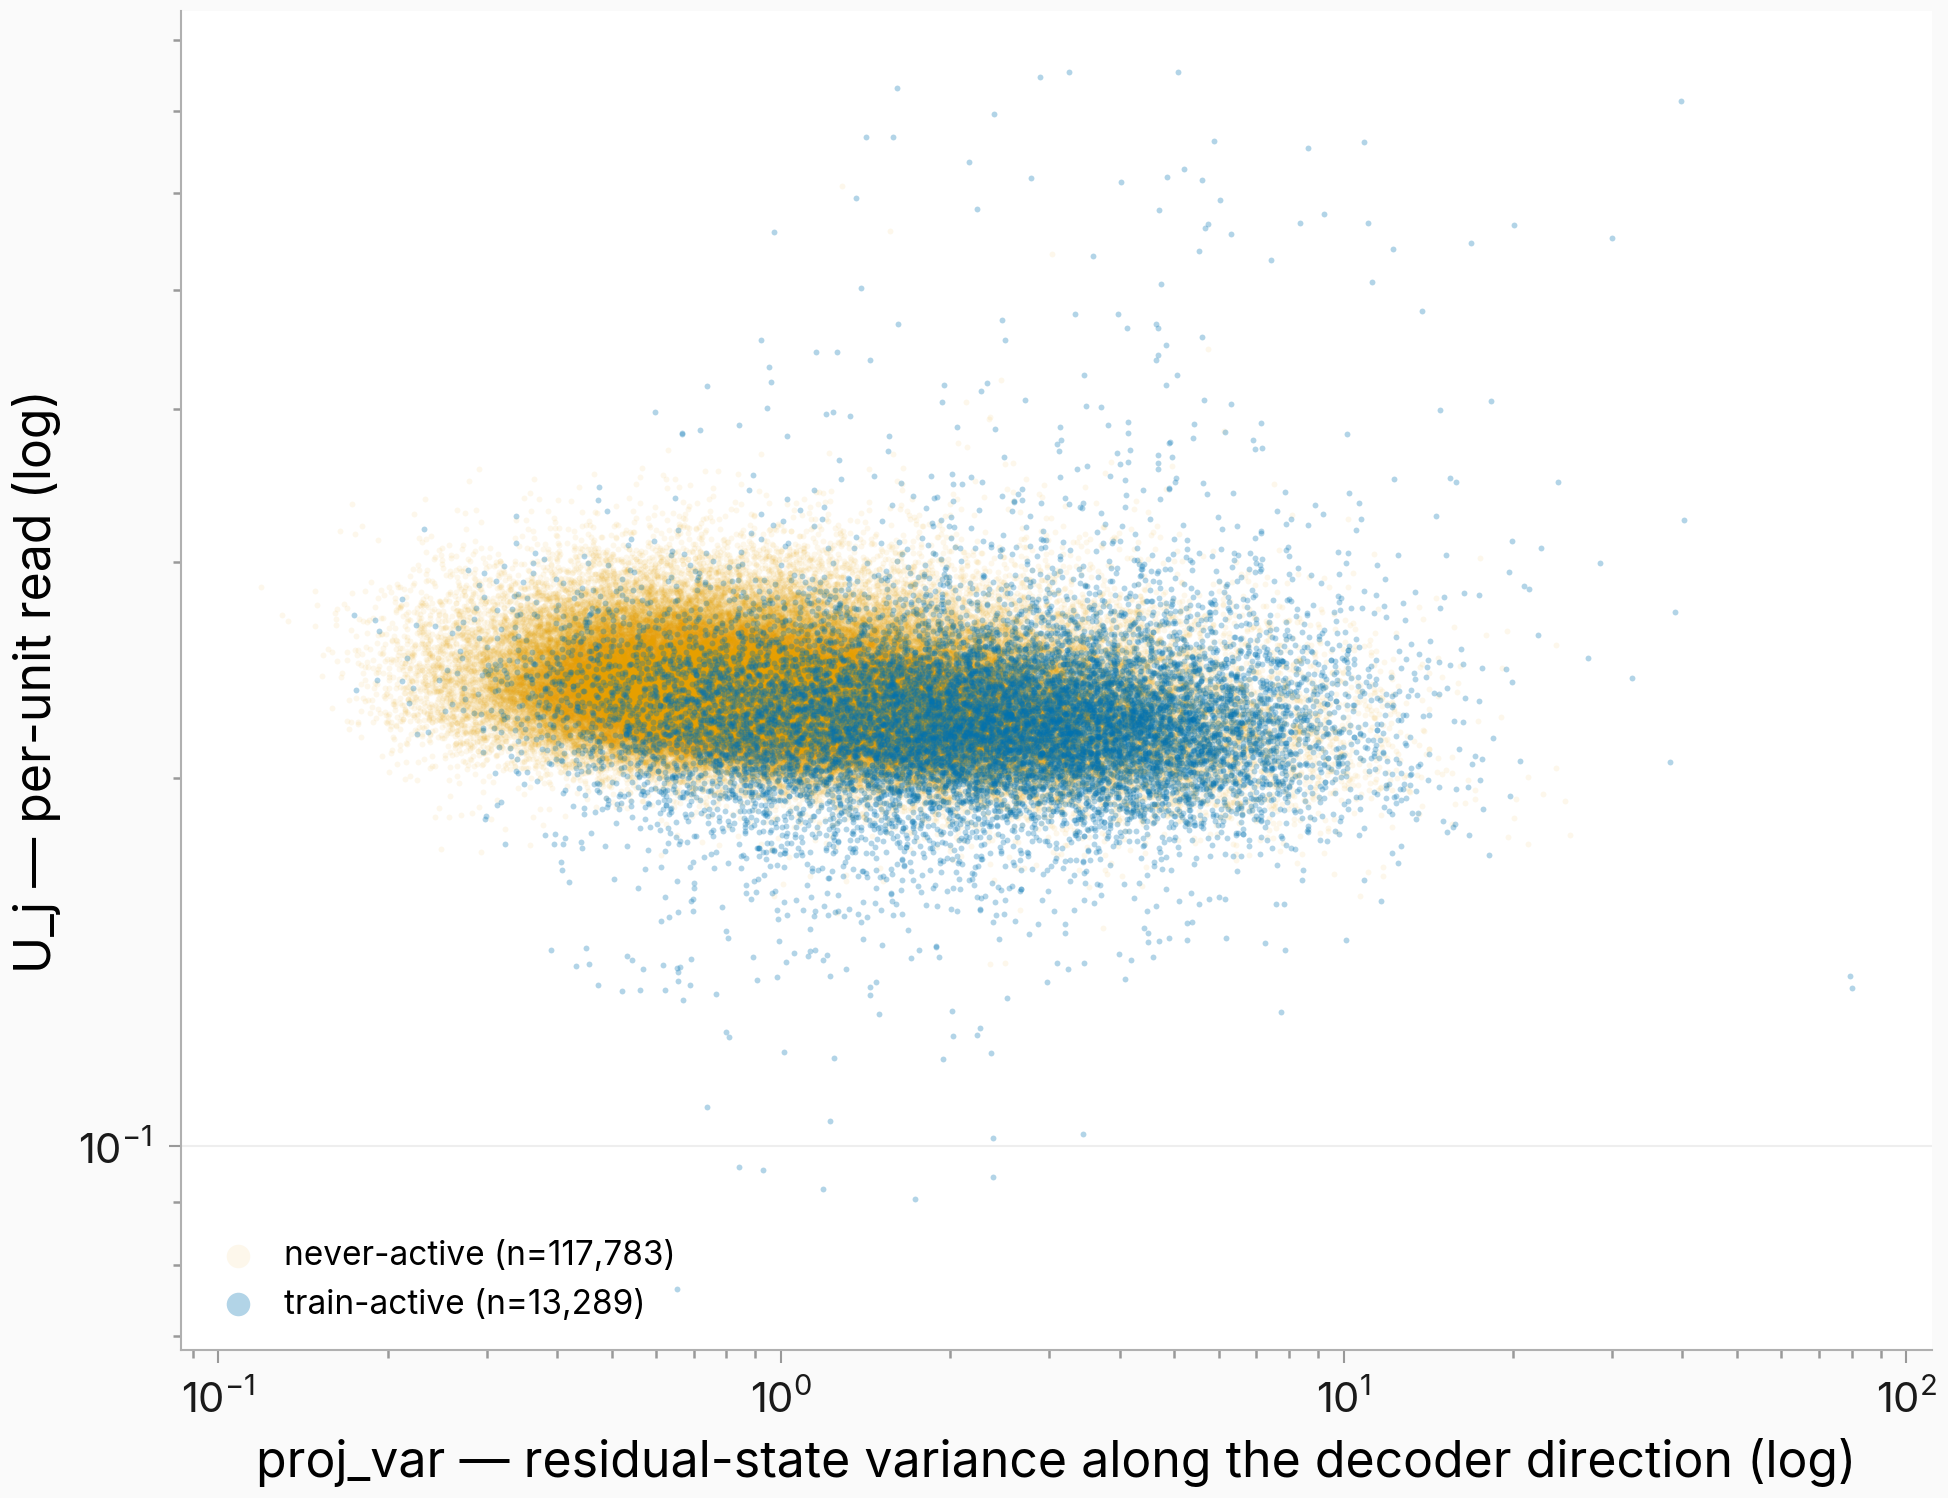
Figure. Raw view of the composition.
U_jvsproj_var(log-log), one point per feature with positive values of both: the never-firing majority (orange) sits at low variance with slightly higher per-unit read and carries the downward trend; firing features (blue) show none. Legend counts are the full-dictionary partition.
Among never-firing features — where matching is inert (a single tie) and the read is pure coefficient geometry — the discounts are large: proj_var −0.260 and scaffold_frac −0.236 against a 0.009 band, write_norm −0.200. Among the 13,282 firing features all three collapse inside the 0.031 band (−0.003, +0.016, +0.007), yet 18 of 24 informative columns clear it: activity −0.220, footprint kurtosis −0.213, per-token firing frequency −0.152, conditional mean activation the strongest positive at +0.166, and consistency sign-flipped to +0.137 from −0.140 — though conditioning on firing is itself a selection that can flip covariate–read associations, a range-restriction alternative left open. The first version of this write-up read the dictionary-wide numbers as selective reading; this split corrects that attribution.
Firing features at the context vector are boundary and formatting machinery; never-firing features are token-identity-anchored content
Left: per-population share of labeled features in 15 non-exclusive keyword description categories (13,204 labeled firing / 114,339 never-firing); right: share differences vs a 1,000-draw label-shuffle band. The per-unit companion shows per-feature distributions of the four strongest mechanical discriminators by rank-AUC = P(firing > never-firing); full ladder: figures/issue_2163/fire_census_auc_contrast.png.
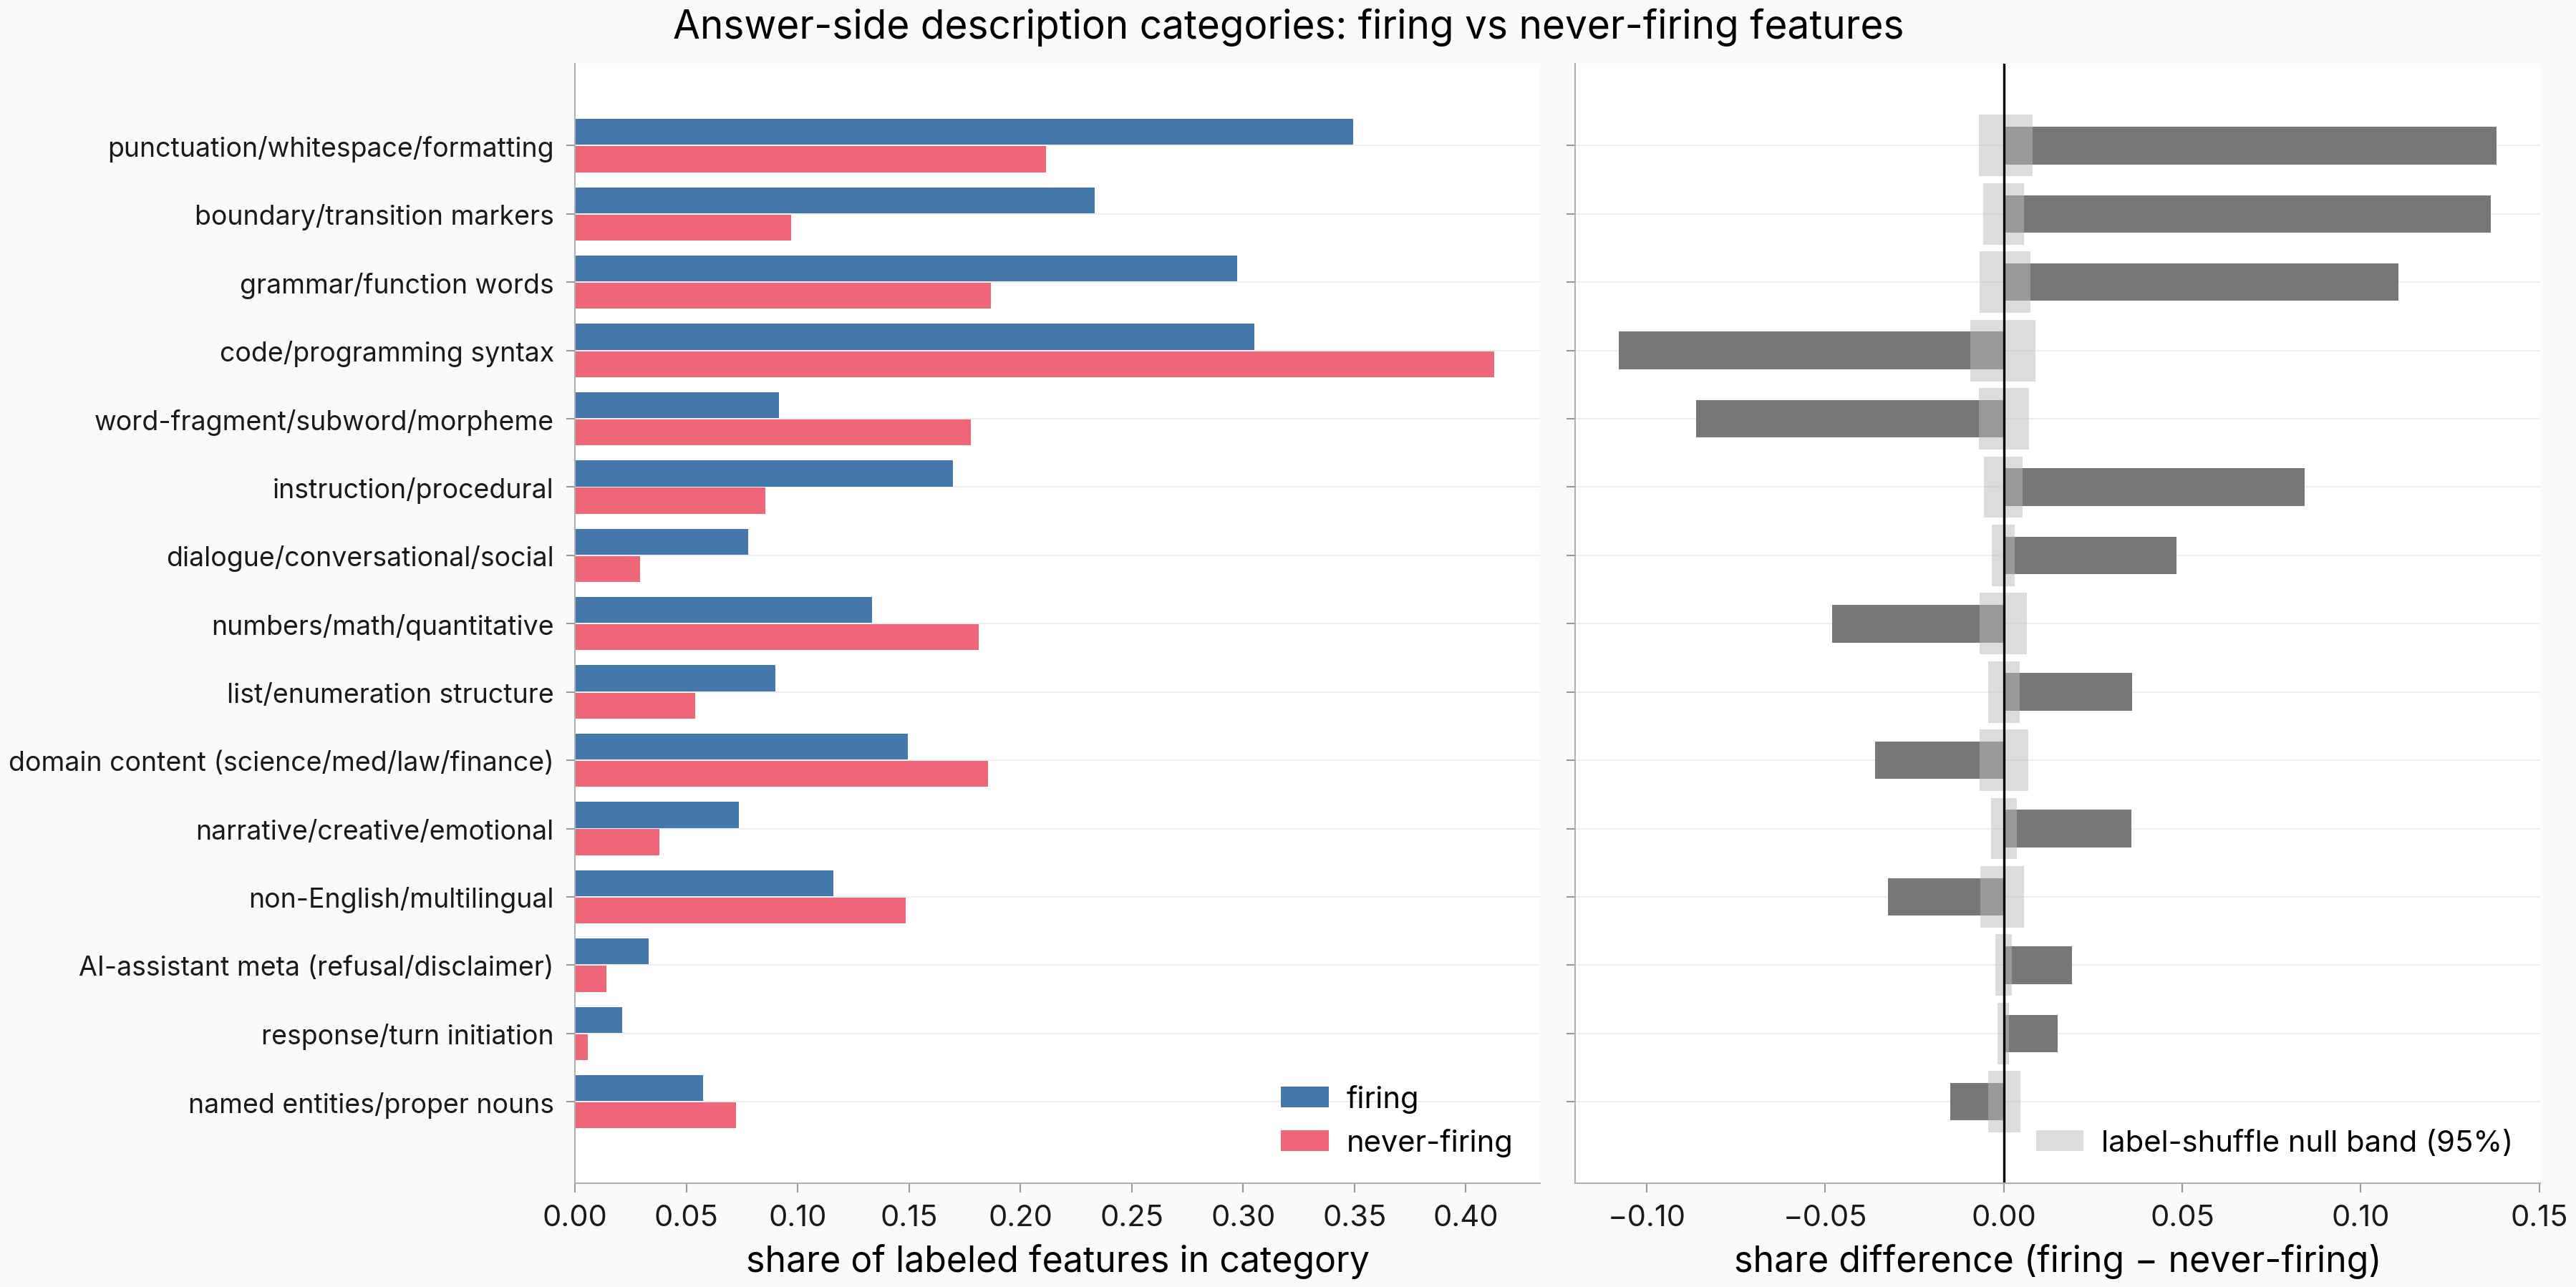
Figure. Firing features skew to structure and discourse; never-firing to token-anchored content. Category shares (left) and share differences vs the 95% label-shuffle band (right); non-exclusive keyword categories, 8.8% of labeled features match none. All 15 clear both bands; at n ≈ 127.5k the bands are tight, so the ranking by difference is the informative read.
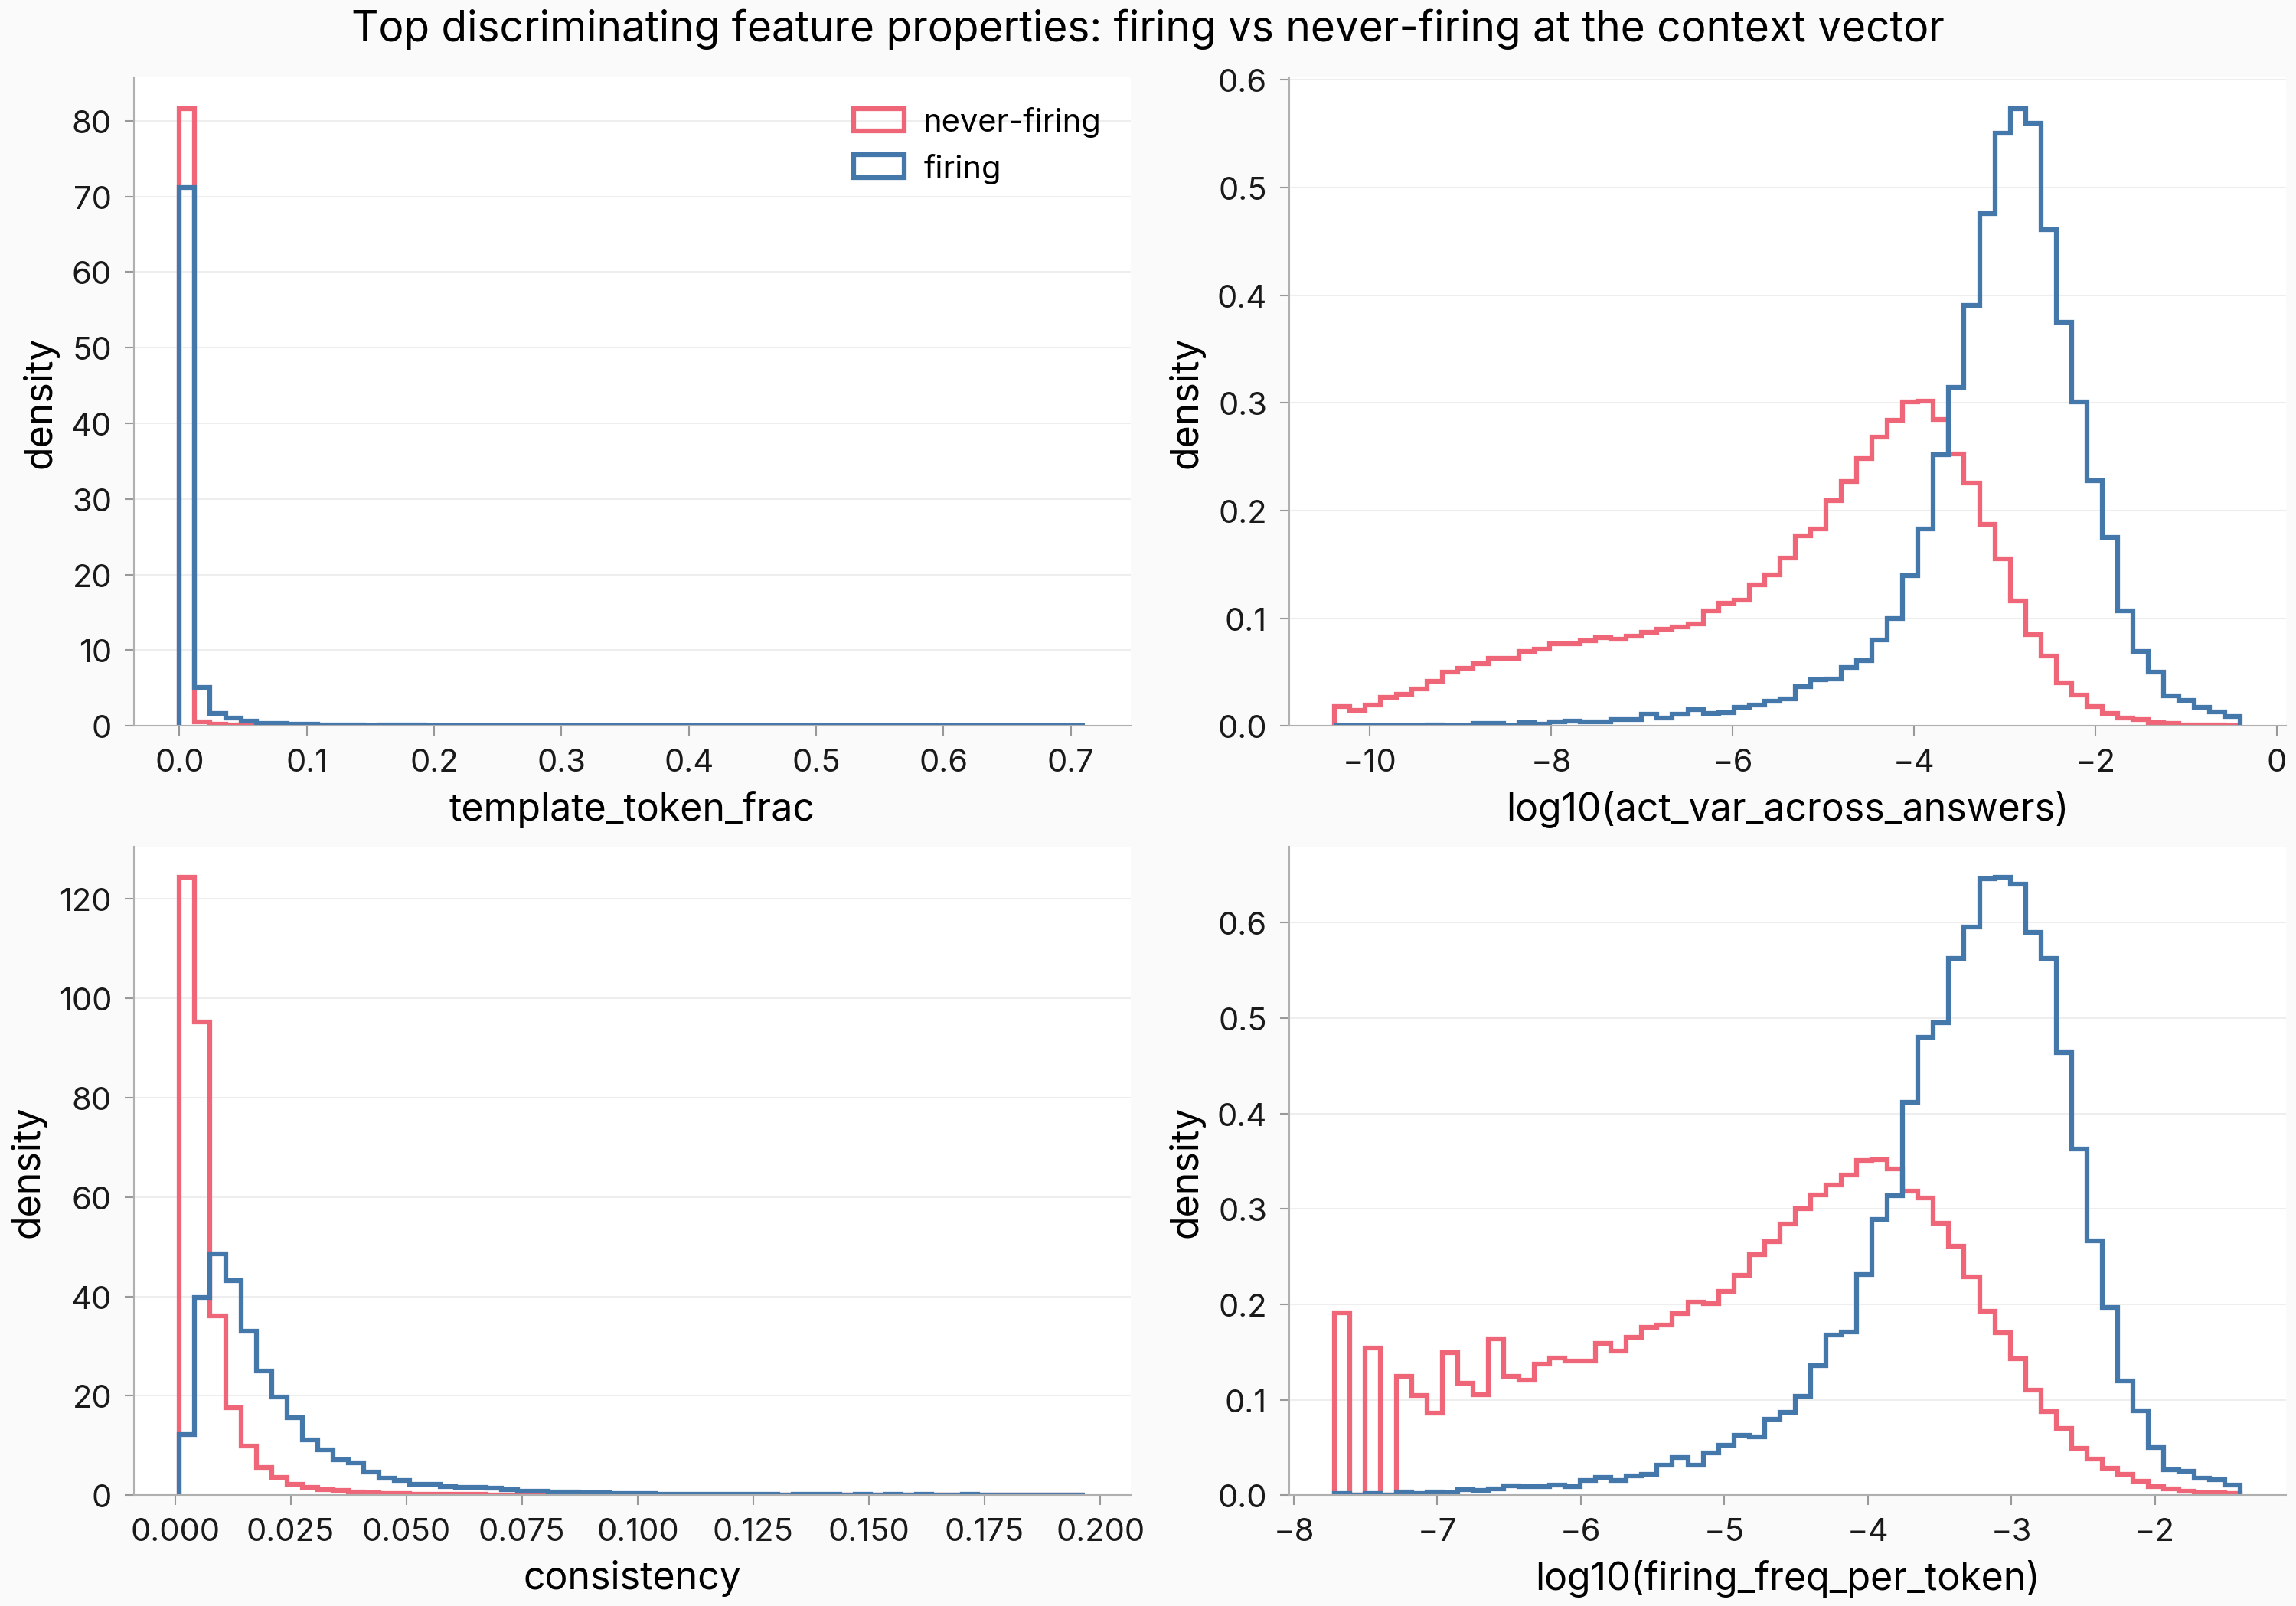
Figure. Per-unit companion to the category-share aggregate: the strongest per-feature contrasts. Density histograms per population: template-token firing share (rank-AUC 0.90), cross-answer activation variance (0.87, log x), consistency (0.85), per-token firing frequency (0.83, log x).
Firing features are high-duty-cycle structural machinery: template-token firing share separates the populations at rank-AUC 0.90, and the top-firing description stratum reads as "something just ended, a response begins" — unit-boundary detectors, response openers, list/markdown delimiters (punctuation/formatting +13.8 pp, boundary/transition +13.6 pp). Never-firing features are anchored to token identities the boundary newline never has (code syntax, subword fragments): their absence at v_C is structural, not sampling. Firing is a discrete offset plus a continuum (bottom-decile firing features sit ~10× above the never-firing median on firing frequency), and write-side geometry barely discriminates: the split is when a feature fires, not how it writes. Context-only features are disjoint: 7 of 1,653 fire pre-mask, five chat-template boundary-newline detectors.
Correlated decoder directions do not rescue the within-active null: the band widens at most 2.4× while the observed maximum stays about 3× outside
Lines: the within-active 97.5% max-over-columns band recomputed with decoder-similarity clusters (connected components at cosine ≥ threshold) permuted as intact blocks, two schemes per threshold; dotted, the original feature-level band; solid, the observed maximum partial. Per-column observed values are the within-active bars in the figure above.
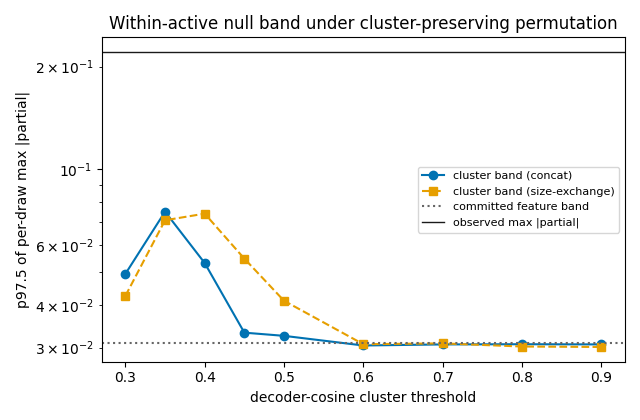
Figure. Correlated-but-not-duplicate decoder directions leave the result intact. 97.5% band of the per-draw max under cluster-preserving permutation, by decoder-cosine threshold and scheme; dotted: the committed feature-level band (0.031); solid: the observed max |partial| (0.2205). 1,000 draws per point, n = 13,282 firing features.
Near-duplicate decoder directions — the exchangeability worry this check targets — do not exist: the maximum pairwise cosine among the 13,282 firing features is 0.769, so at the conventional 0.8 duplicate criterion every feature is a singleton and the band is unchanged. Thresholds down to 0.30 therefore stress correlated-but-not-duplicate directions: the band widens at most 2.43× (threshold 0.35) while the observed maximum stays 2.94–7.32× outside, and at least 15 of 24 informative columns stay outside at every threshold under both schemes. The 0.30 band sits below 0.35 because clustering percolates there: a 6,467-feature giant component, confined to one stratum, limits its own randomization — and freezes 49% of features under size exchange — shrinking the per-draw maxima.
The map's per-unit read is unrelated to what a feature univariately carries about the answer
Each point is one of the 13,289 train-active features, colored by last-token activity decile: carried information (univariate held-out R², linear y) against the per-unit read (left half, log x) and against the frequency-weighted ablation contribution (right half, log x).
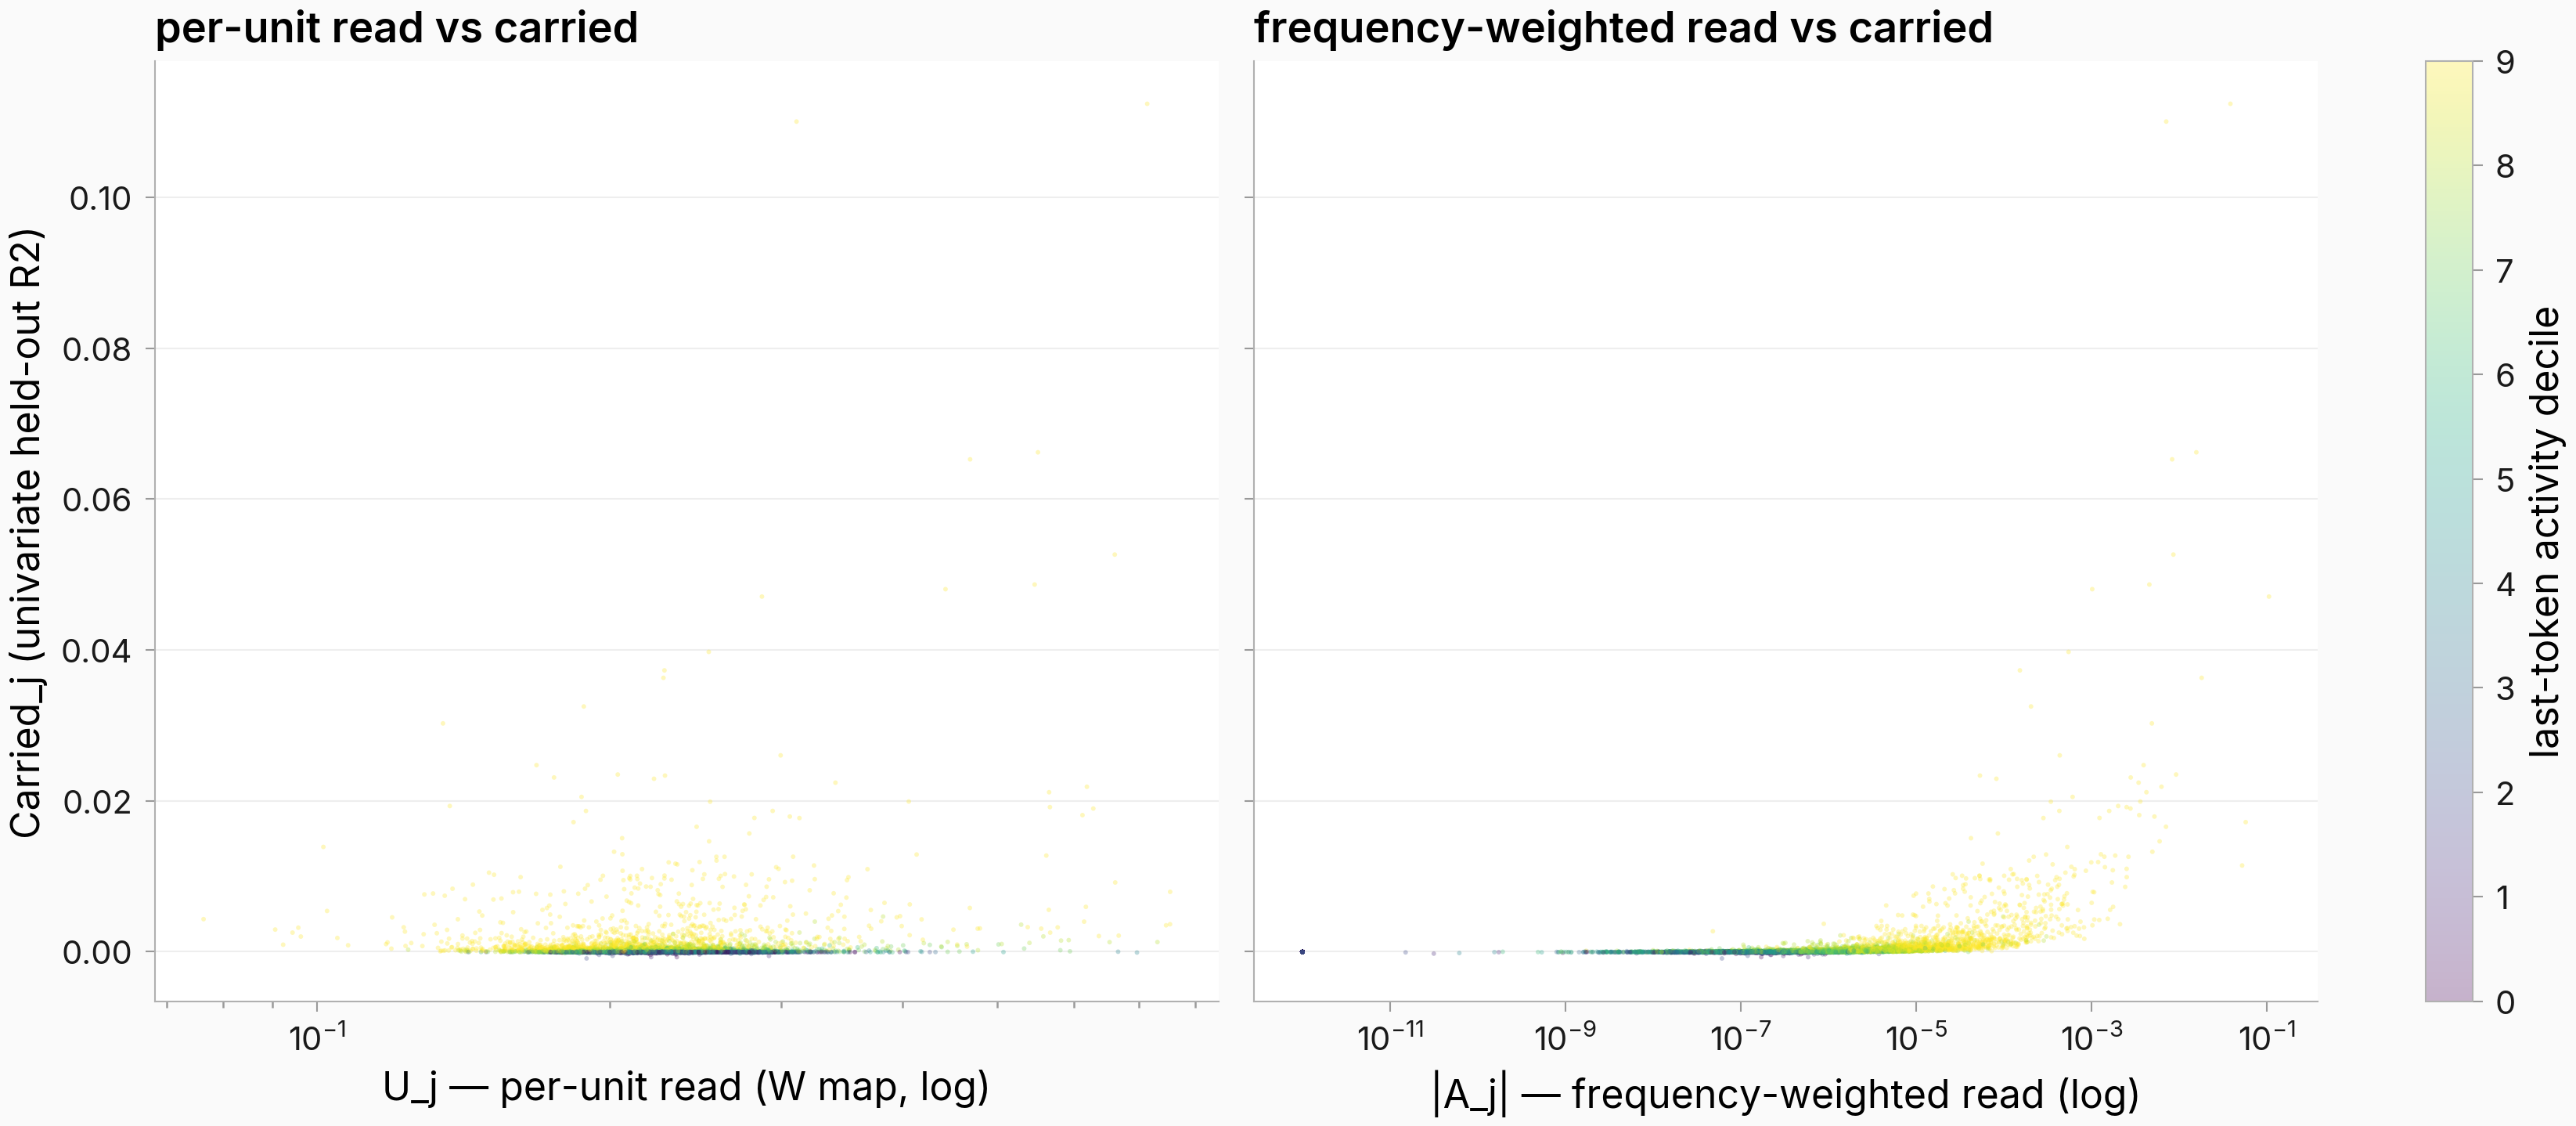
Figure. Carried information concentrates in high-activity features; it tracks the frequency-weighted read, not the per-unit read. Carried (linear y) vs
U_j(left) and |A_j| (right), log x, one point per train-active feature; this scatter is itself the per-unit view.
The per-unit read is rank-unrelated to carried information: Spearman −0.05 overall, rising 0.00 to 0.36 across activity deciles; the frequency-weighted read correlates 0.59 — read–carried agreement is mostly frequency. 661 features sit in the high-carried, low-read tail; median nearest-duplicate cosine there matches the population (0.336 vs 0.340), so duplicate absorption explains at most about half the tail — though single-term deletion lets no other coefficient compensate, so this stays suggestive. Summed over features, ablation contributions total 0.508 of holdout variance vs 0.486–0.490 under pairing permutation — a small alignment-specific excess; with 200 draws the per-feature floor is p = 1/201, so per-feature claims stay descriptive. Across corpus halves, ablation ranks correlate 0.30 over all 131,072 features (tie-dominated by structural zeros) and 0.57 among the 4,818 features nonzero in both halves.
The cheap algebraic read matches the refit coefficients only where features are well-estimated
Each point is one of the 4,588 restriction features: x = U_j (algebraic per-unit read), y = the refit coefficient row norm, log-log.
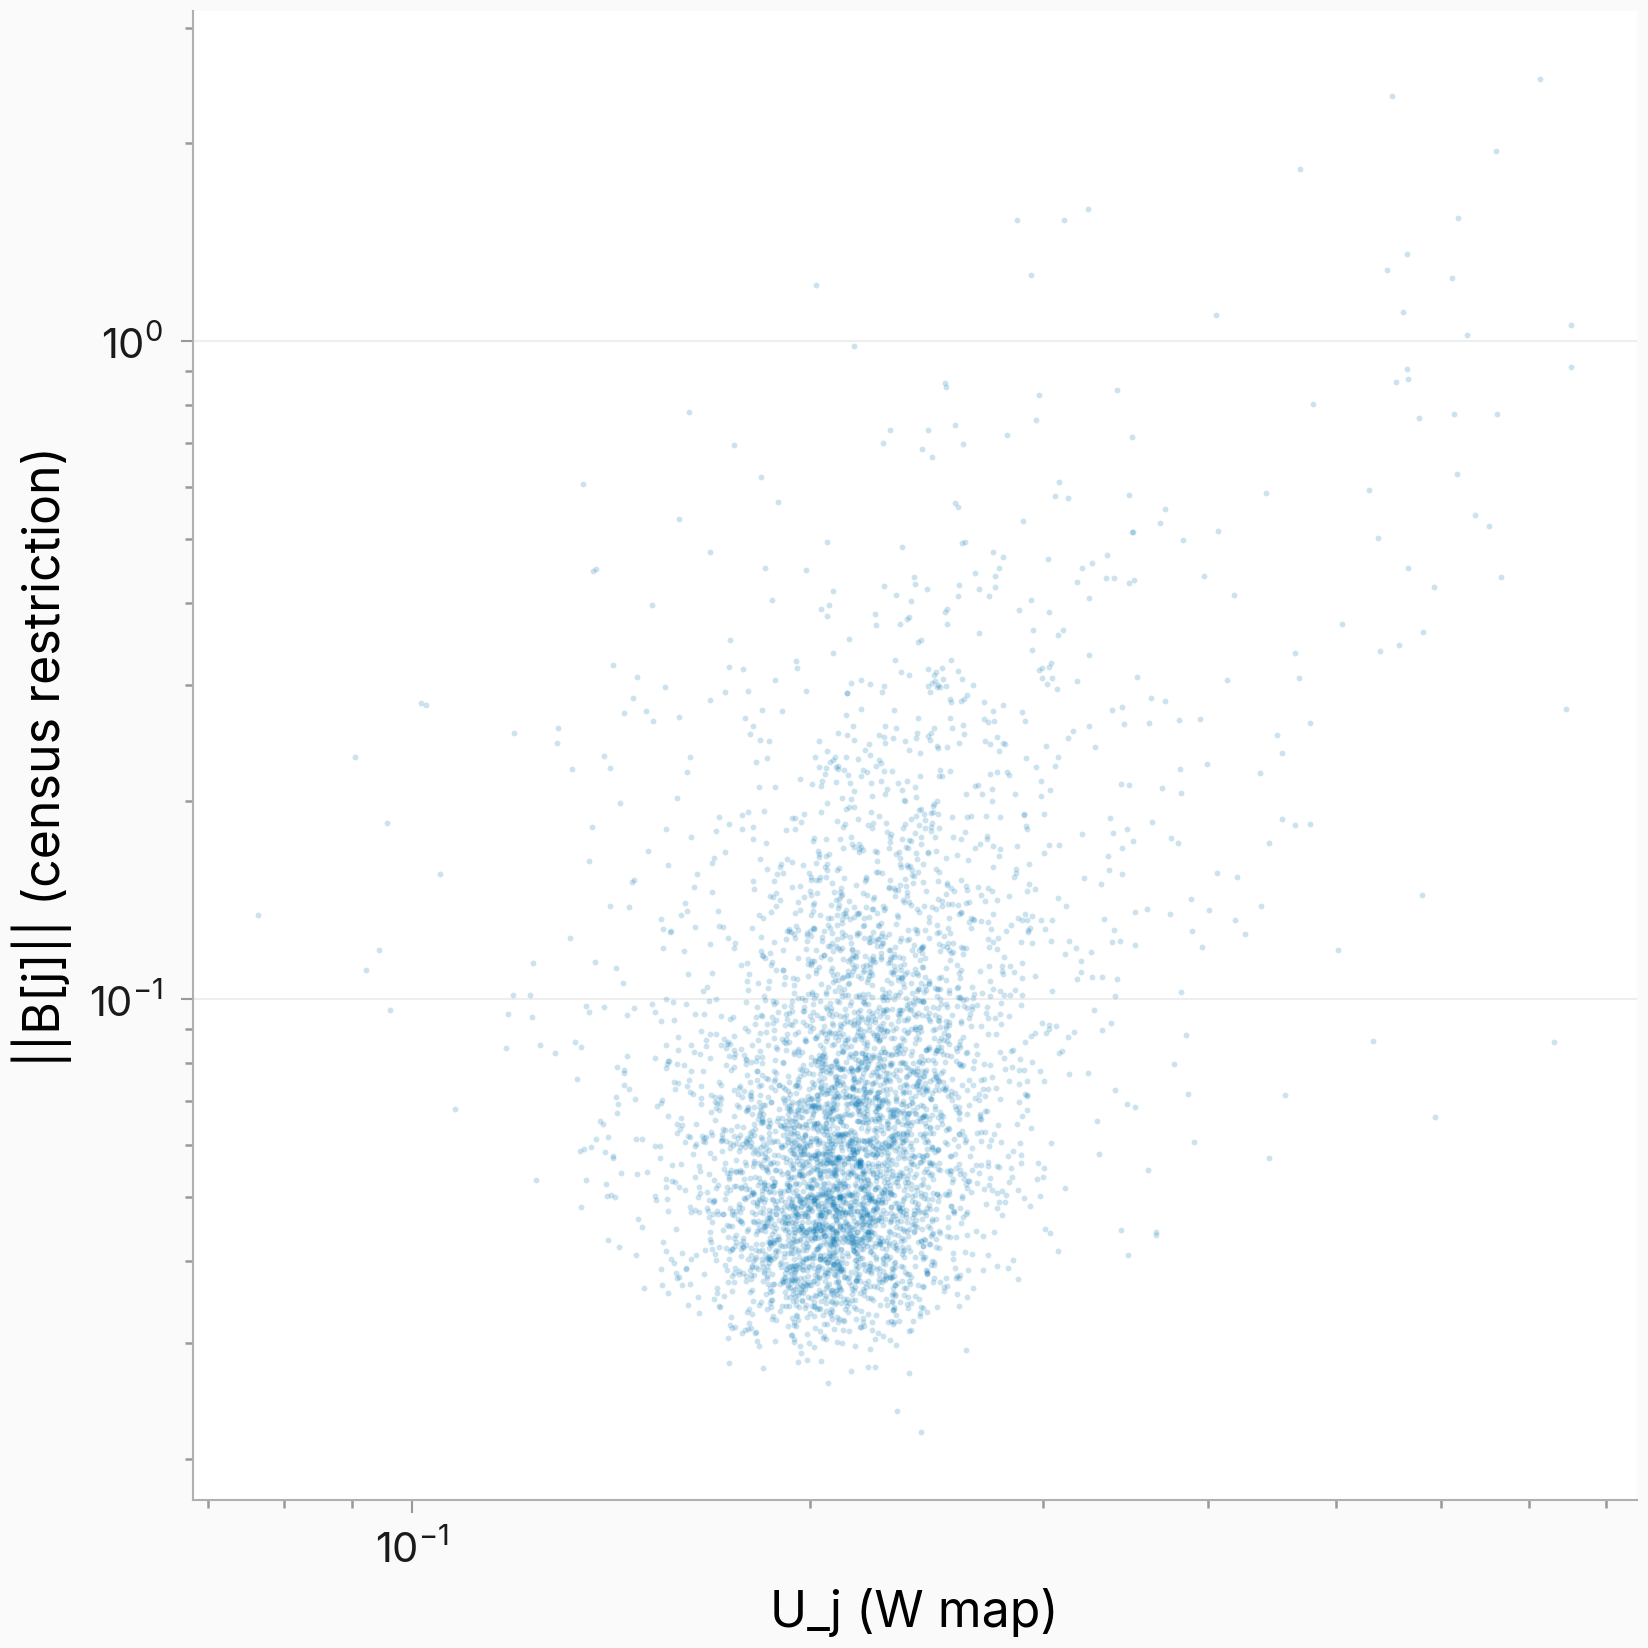
Figure. Agreement between the algebraic read and the refit's own coefficients is activity-dependent. Coefficient row norm of the last-token refit vs
U_j, one point per restriction feature (n = 4,588), log axes.
Overall Spearman is 0.285, rising across activity deciles from 0.25 (decile 0) to 0.74 (decile 8) — with a dip to 0.34 at decile 3, and 0.61 in decile 9. That pattern matches frequency-dependent ridge shrinkage — the refit shrinks rarely-firing features toward zero while the algebraic read does not — rather than an unfaithful read; the scope-narrowing criterion (Spearman under 0.5 on well-estimated features) did not fire. The refit is well-posed (n_train/d = 26.2, penalty selected on the validation carve) and scores holdout pooled R² 0.647 vs the full map's 0.653. The planned GPU cell never ran: d_B = 4,588 sat far below the 32,768 venue switch, so this arm completed on CPU.
Most of the rare-feature predictability deficit on the answer side is sample size
Lines: median per-feature answer-side R² by activity decile on the 16,384-feature panel — pooled (all holdout rows), conditional-on-active, and matched-n (each feature rescored on 200 draws of 1,707 active rows, the rare-decile median; 113 of 200 selected decile-0 features had enough rows). The companion scatter is the raw per-feature pooled R² against holdout active count.
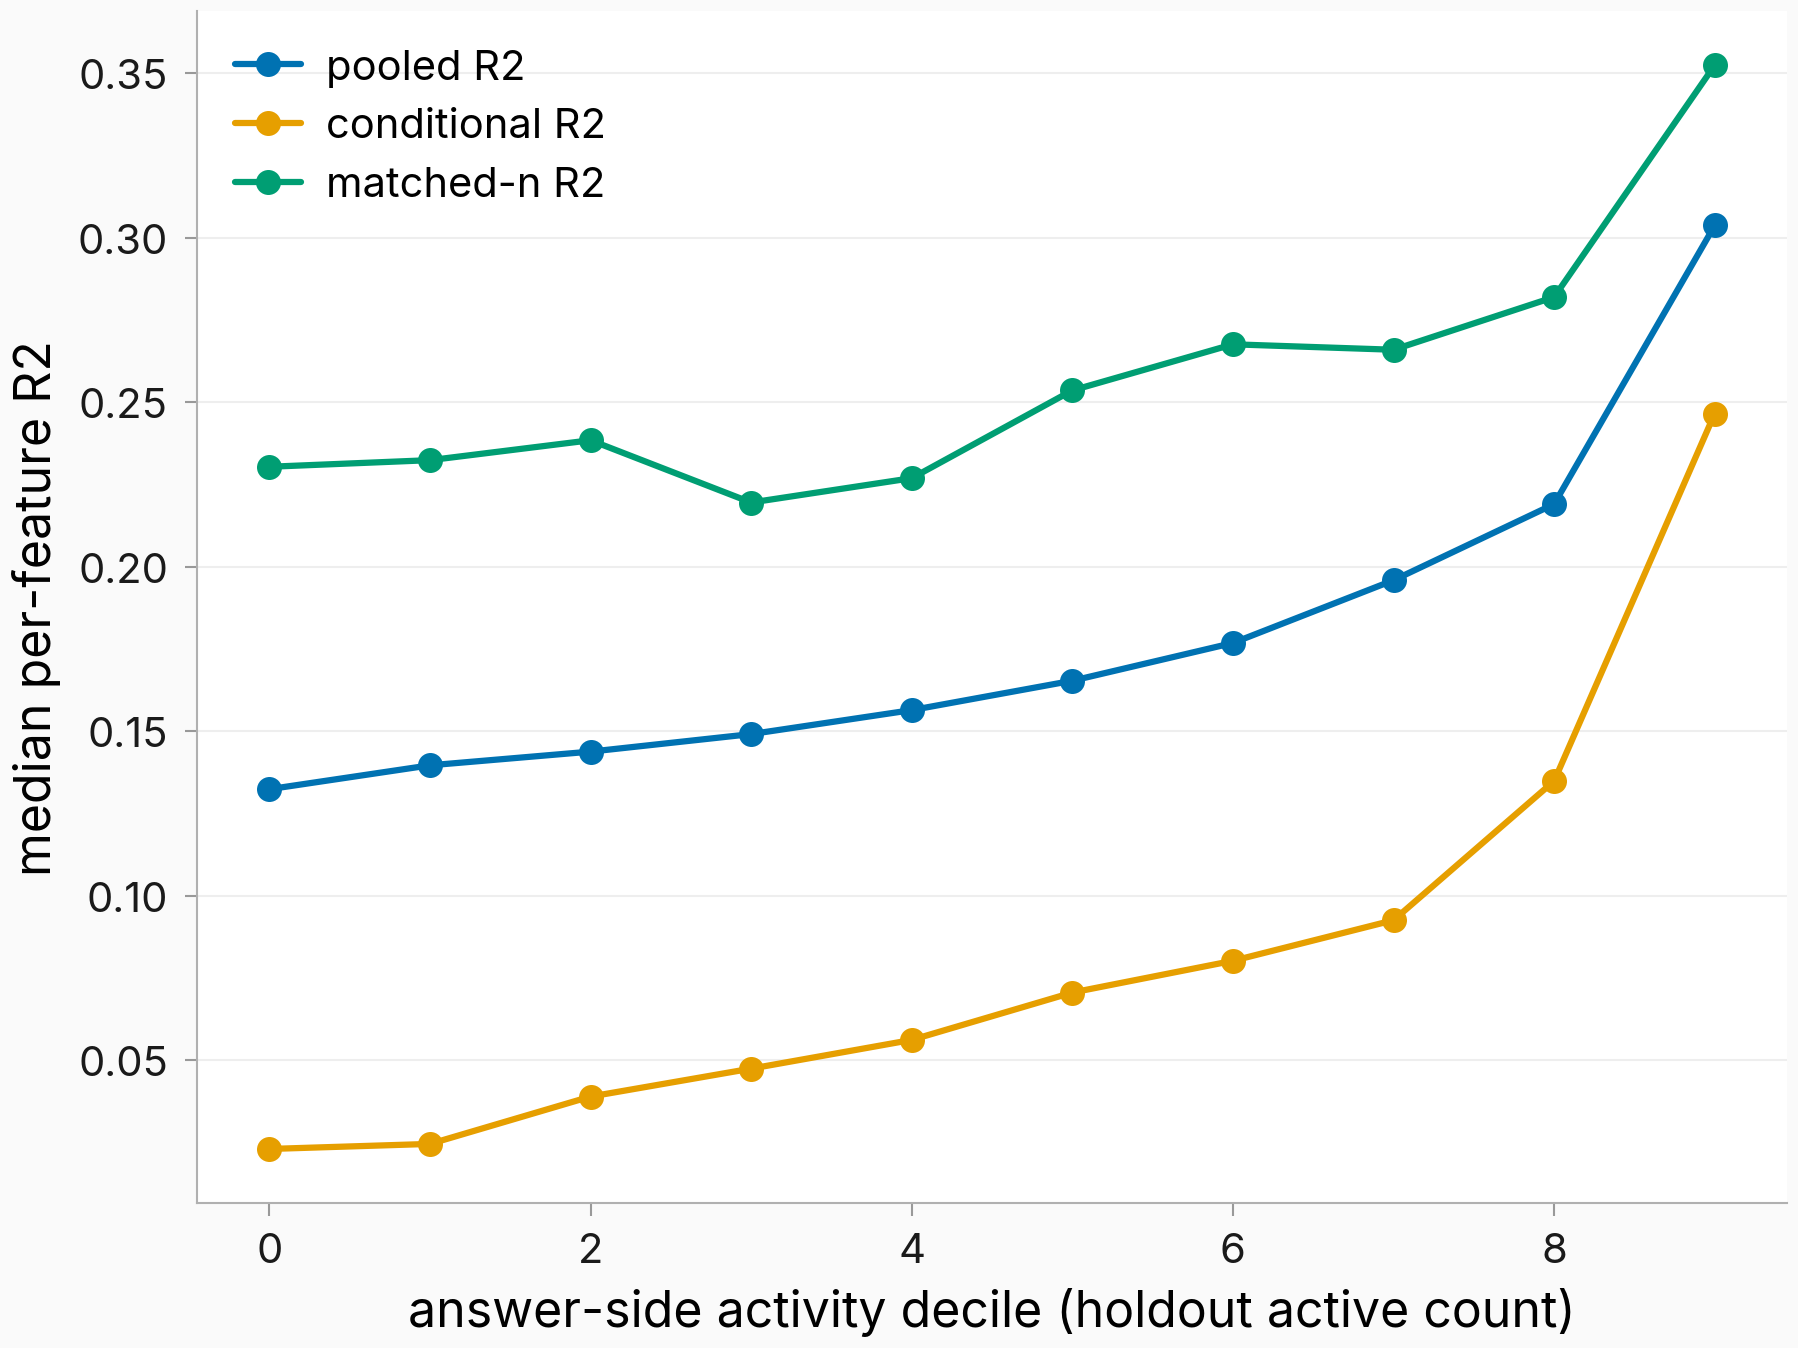
Figure. Matching row counts flattens the low-activity half of the gradient. Median per-feature R² by answer-side activity decile: pooled, conditional-on-active, and matched-n (1,707 rows per draw); raw per-feature companion below.
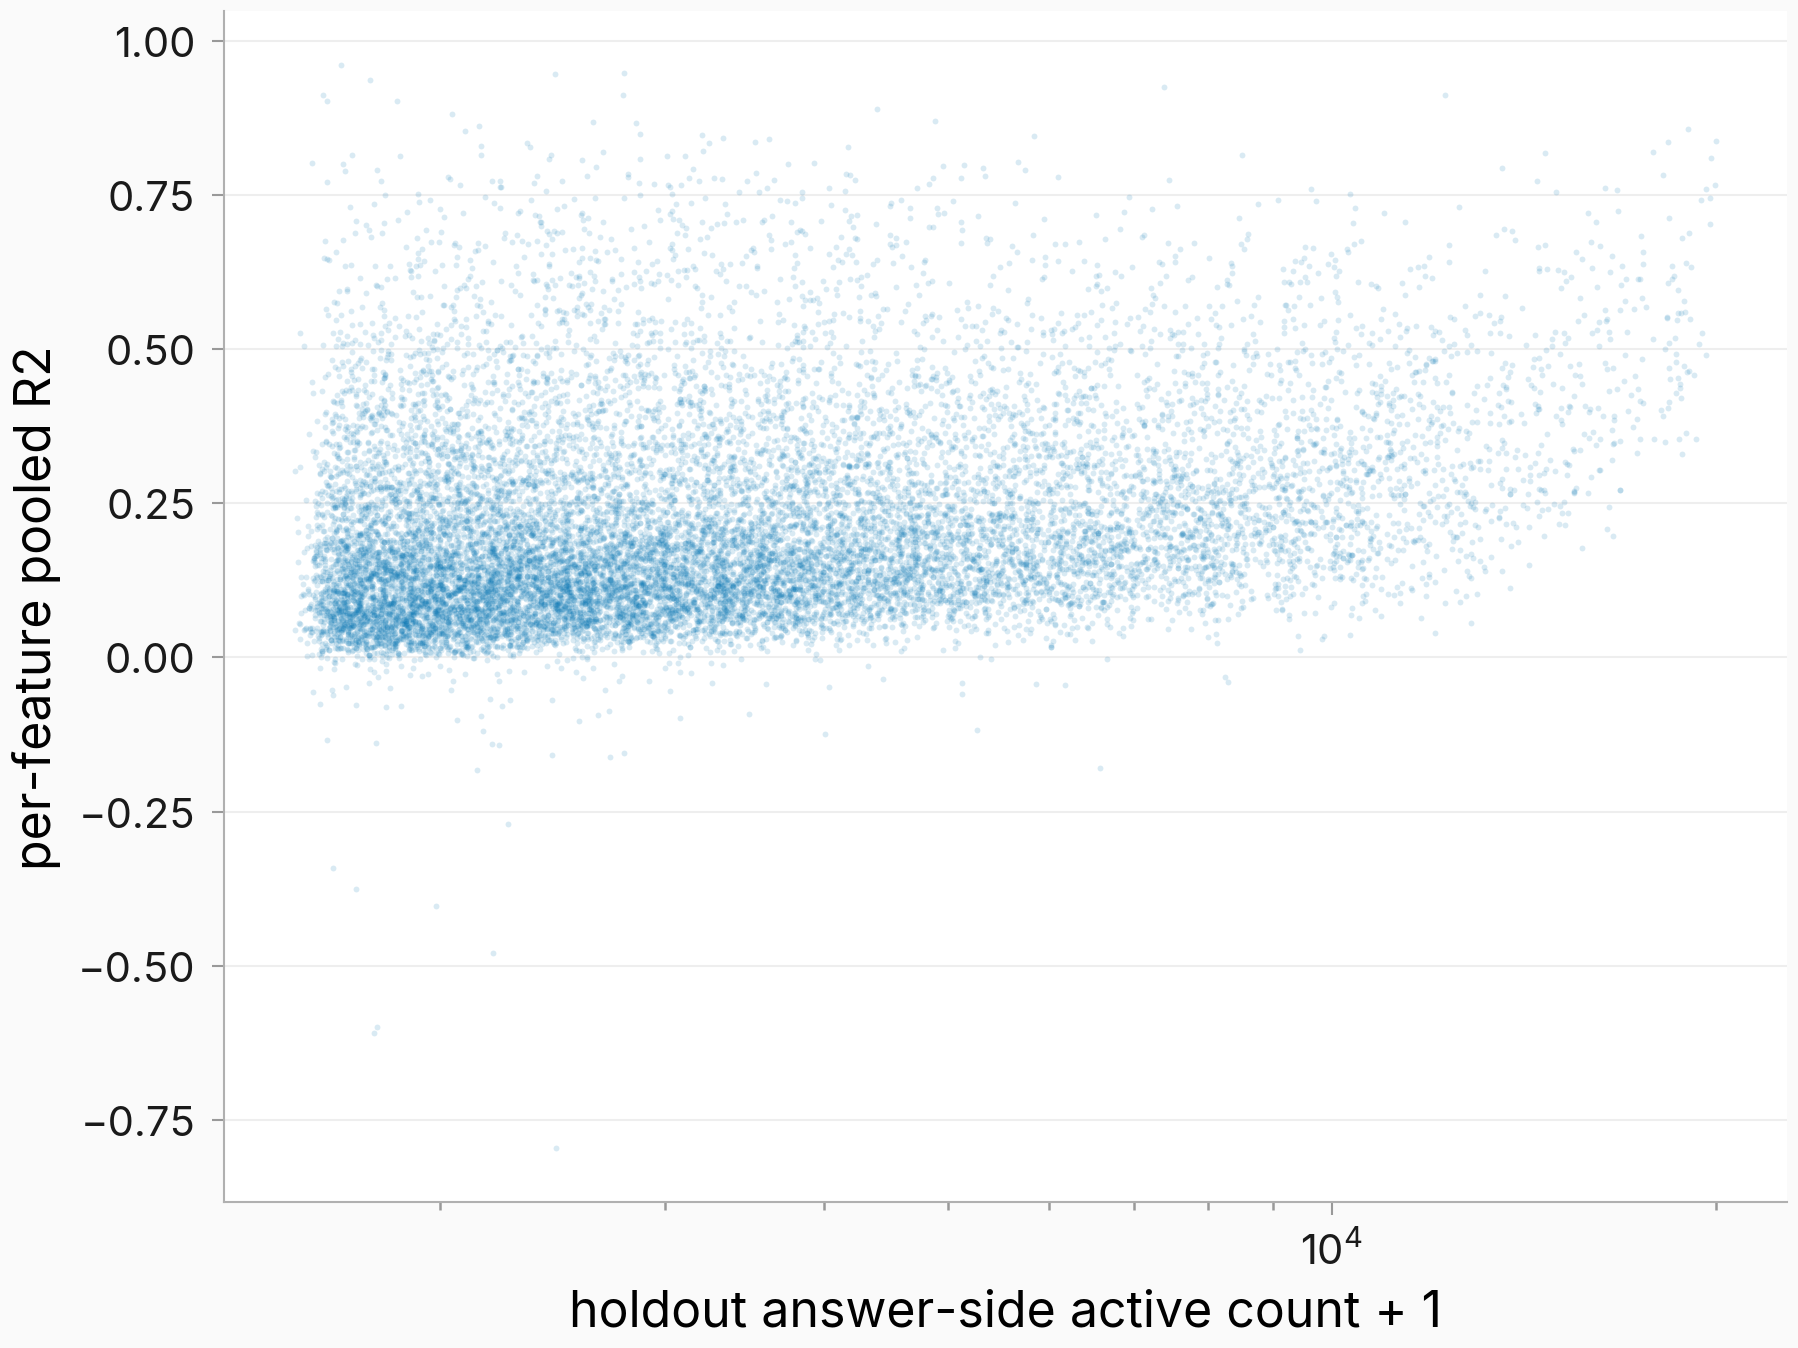
Figure. Raw companion. Per-feature pooled R² vs holdout answer-side active count + 1 (log), one point per panel feature (n = 16,384).
Pooled medians rise 0.132 to 0.304 across deciles here; the sibling full-dictionary estimate of the same gradient (0.091 to 0.266) covers a different feature set, so levels are not directly comparable. Under matched row counts the bottom five deciles flatten to 0.22–0.24 — rare features are predicted about as well as mid-frequency ones once scored on equally many rows — and the residual gradient concentrates in the top two deciles (0.28, 0.35). The smooth low-decile half of the gradient is a sample-size artifact; a genuine high-activity advantage remains.
Retrieval: the dense→dense map identifies the held-out context; the feature-basis maps rank it top-10
Bars: retrieval accuracy at rank 1 (chance 1/20,000) per map and distance metric — predictions from 5,000 holdout probes matched against the full 20,000-row holdout pool.
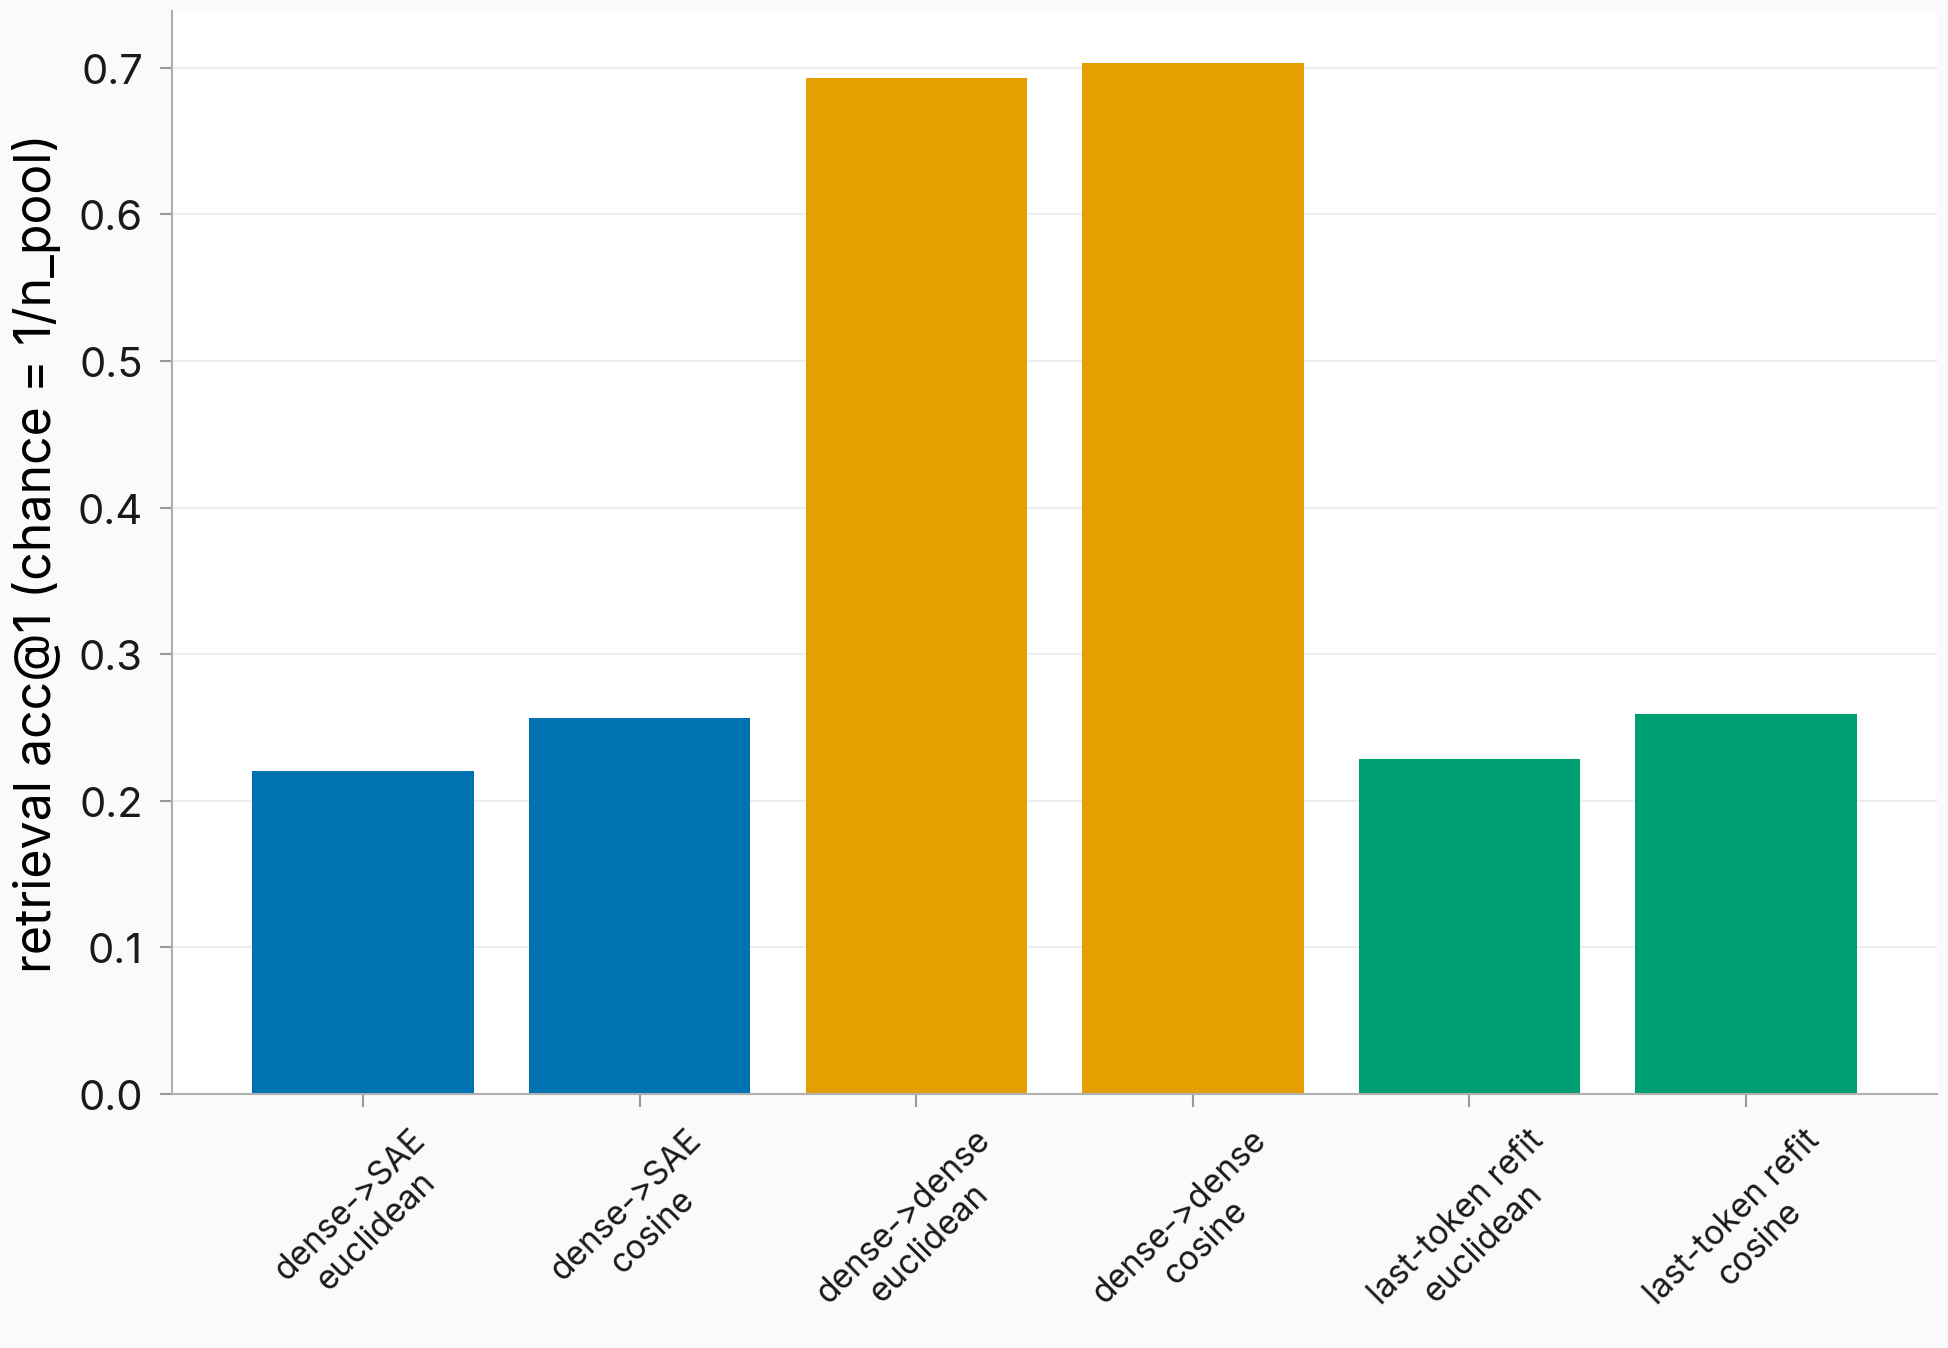
Figure. All three maps retrieve far above chance; the dense→dense map dominates. Accuracy at rank 1 by map and metric, 5,000 probes vs a 20,000-row pool, chance 5e-05. Per-probe decomposition is a binary hit, so no per-unit companion is embedded.
The dense→dense map retrieves the true held-out context at rank 1 for 70% of probes (cosine; median rank 1; its identity-plus-learned-bias baseline scores R² −1.02, so it is far from a copy map). The dense→SAE map and the refit both reach 26% at rank 1 (median ranks 8–11). One caveat: the probe set is the first 5,000 holdout rows, which the corpus join shows are 100% LMSYS — the same probe convention as the sibling comparison line, but these retrieval numbers are LMSYS-only reads.
Repro: ~1.2 h wall on a 16 vCPU / 128 GB RunPod CPU pod (pod-2163) + ~17 min VM harvest; realized GPU-hours 0 (the conditional GPU cell never triggered). Driver: scripts/issue2163_ctxread.py (pod phases ran at commit c258775889, clean tree per each JSON's run metadata; the round-1 VM figure render ran with the driver locally modified — harvest_meta.json records the dirty flag — while the four round-2 figures were rendered from a clean tree at 58ccd3d505; all links here are re-pinned to the round-3 commit afd8867e28, which carries every earlier file unchanged). Round-2 population split: scripts/issue2163_population_partials.py → population_partials.json (zero GPU, VM-local; full-pool reproduction gate max deviation 1.1e-16). Round-3 cluster-preserving null: scripts/issue2163_cluster_null.py → cluster_null.json + cluster_null_labels.npz (zero GPU, VM-local; ran at 58ccd3d505 with the round-2 script's thread-cap fix locally applied — recorded in the JSON's dirty-tree metadata — and reproduced the committed within-active partials with maximum absolute difference 0.0). Eval JSONs + per-feature npz + stratified-permutation matrices: eval_results/issue_2163/; the two row-pairing null matrices (100.5 MiB each, draws_dsse shape 200 × 131,072 fp32 — landed fp32 vs a smaller fp16 plan estimate) exceed the git per-file limit and live on HF only. HF (all pinned): results (22 files incl. nulls/), analysis_tensors (W/M bundles, B Gram + panel block, last-token CSR), inputs (9 files incl. dense answer targets + covariate panel v2). Raw completions: n/a — no generation stage anywhere in this task. Declared discard: the full holdout prediction matrices (20,000 × 131,072 fp32 per map, ~10.5 GB each) — pure derived matrix products; regenerate with one blockwise matmul of the persisted bundles against the banked holdout inputs. Reused artifacts — from #1482: the 1,920-shard pooled/last-token SAE code store (issue1482_error_analysis/analysis_tensors/sae_pooled/), dense input matrix + sha-pinned splits (issue1482_densesae_fullwidth/inputs/), banked ridge cells + bridge JSONs (the parity targets), covariate panel v2, and the corpus-label join arrays (scratch_meta/) — fit: same SAE revision, splits, and penalty grid read off the artifacts' own configs, with all six reproduction gates PASS (tolerances 1e-3/5e-3; realized max per-feature |ΔR²| 2.978e-08, so no upstream drift reached this run despite the unpinned data-repo revision). From #779 via the parent: the 23-point penalty grid and the dense capture lineage. Dense answer targets (Y_L19.f32.mm) were uploaded from the VM to issue2163_ctxread/inputs/ before any pod work, with a sha256 content pin against the banked input copy. Fire-census round (2026-08-13, zero GPU, VM-local, user-chat inline): scripts/issue2163_fire_census.py → eval_results/issue_2163/fire_census_characterization/ (summary, AUC table, category counts) + three figures/issue_2163/fire_census_* figures, all at commit c835e32fa6; description bank staged from HF issue1773_featurepipeline/recovery_1934/ (42 MB, re-downloadable).
Context:
we also trained a SAE feature -> answer vector mapping. Since we want to see what kind of information is stored at the context vector (newline before assistant speaks) we want to do a similar analysis to the answer vector but seeing which predictors most predict whether a SAE feature is read at the context vector. I am not sure how to formalize that the mapping reads from this SAE feature - potentially we can invert the mapping? or do some zero-ing out and measure effect on output? or just look at the mapping matrix and do some linear algebra. can also use the SAE -> SAE mapping if that's easier. [then] why aren't we using all the features??? [then] run this in the background as much in parallel as possible
Lineage: #1482 — parent; the output-side mirror of the same map. Created 2026-08-07; run 2026-08-07 (single experimental round; interpretation revised the same day in critique round 2 with a zero-GPU population-split analysis, then extended in round 3 with a zero-GPU cluster-preserving null check on the within-active band; extended 2026-08-13 with a user-requested zero-GPU fire-census round characterizing the firing vs never-firing populations).