Training a marker into more source personas did not measurably flatten the leakage-vs-distance gradient (MODERATE confidence)
Human TL;DR
Headline. I trained the same single-token marker into 1, 2, 4, or 8 source personas and asked whether widening the source set makes the marker's post-response log-prob become persona-invariant. It didn't measurably flatten — every K's leakage-vs-distance line has essentially the same slope, the near-vs-far gap sits around 3 nats across K, and the level just shifts up.
Takeaways.
- The "marker log-prob becomes persona-invariant as K grows" story isn't supported here: per-K slopes of marker log-prob trained − base vs log persona-distance are −1.37, −1.41, −1.35, −1.32 for K=1/2/4/8 (each p < 1e-100), and the near-vs-far gap shrinkage is −0.12 nat per log₂ K, p=0.15.
- Training into more sources clearly raises marker log-prob everywhere (mixed-effects K coefficient +0.083, p=0.004), and both near and far bands rise by about 0.5–0.9 nat from K=1 to K=8, but the shape of the line is stable.
- The model never emits ※ as its visible argmax on any held-out persona at any K (0/2800) — what shifted is the post-response affinity for the marker, not visible behavior. The construct is a log-prob shift; calling it "leakage" is shorthand for marker-affinity leakage.
How this updates me. I update against "more source personas → behavior becomes persona-invariant" as the right picture for marker-affinity at this scale. The right picture looks more like "more source personas → uniform upward shift, with the same distance dependence baked in." That nudges me away from K-as-a-flattening-knob and toward asking what would flatten the gradient (composition / similarity of the source set, anchor strength, marker token itself). MODERATE not HIGH because this rests on 2 seeds + a single model with flatness tests that came in non-significant (not p < 0.01); a large flattening is ruled out, but a modest flattening can't be excluded from these numbers alone.
(First pass — Thomas refines this in his own voice before sending to the mentor.)
TL;DR
Motivation
When I train a single token into one source persona's completions and then read the marker's on-policy log-probability under held-out personas, the trained − base log-prob shift falls off with persona-distance from the source — close held-out personas show a large shift, distant ones show less. The natural follow-up is whether widening the set of source personas (training the same marker into K personas at once) makes that distance dependence flatten — i.e. whether the marker's log-prob becomes persona-invariant in the limit, as if the model has learned "raise log P(※) everywhere" rather than "raise log P(※) when the prompt sounds like THIS source." The parent run swept K ∈ {1, 2, 4, 8} and clearly showed the overall log-prob level rises with K, but couldn't answer the flattening question: its held-out panel had 7 personas bunched near distance 0.01 and a single far persona at distance 0.18, so the distance axis had essentially no variance and the K×log(min_dist) interaction was a single-anchor leverage point — full-panel β(K×log(min_dist)) = −0.81, p=0.011, but dropping the single far comedian sent it to β = −2.14, p=0.51. This run rebuilds the held-out panel to span the distance range with multiple personas per band — 35 held-out personas across 6 distance bands — so the slope test is actually powered, and asks whether the log-prob-vs-distance line goes flat as K grows.
What I ran
Single-token marker ※ (Qwen-2.5 BPE id 83399, leading space) trained into K ∈ {1, 2, 4, 8} source personas drawn from a 16-persona pool, with 8 disjoint subsets at each of K=2/4/8 (and 16 single-source subsets at K=1) so no single subset carries any K-level claim. Each training mix is 800 rows total at a 1:1 positive-to-negative ratio against 4 fixed contrastive negatives (software_engineer, kindergarten_teacher, helpful_assistant, no_persona); positive rows append ※ after the source's own on-policy response under marker-only loss masking, negative rows omit the marker. Total ※ training dose stays at 400 positives across K, but per-source dose drops 8× — K=1 puts 400 positives on a single persona, K=8 puts 50 positives on each of 8 personas (rows_per_positive = 400 / 200 / 100 / 50 for K=1/2/4/8). LoRA on Qwen-2.5-7B-Instruct, 2 seeds (42, 137), 80 CORE cells in total (40 per seed). After training I read log P(※) on-policy at the slot right after the model's own generated response under each of 35 held-out personas × 20 fixed questions, and report the trained − base delta. The 35-persona held-out panel spans cosine distance ≈ 0.02 (near professional twins like medical_doctor) to ≈ 0.20+ (distant villain / comedian families like joker, brazilian_comedian), with several personas per band so each K's log-prob-vs-distance line is estimated from points distributed along the x-axis. I also bolted on a small Phase-0b probe (base-model only, post-response slot, 8 pre-screened single-token markers × 35 personas × 20 questions) to measure per-marker baseline log-prob — this was added afterward in analysis recovery (omitted at launch, run after CORE finished, no effect on training or CORE eval) and feeds the per-source-distinct-markers arm caveat.
Example training rows (cherry-picked from the 800-row K=1 librarian_detective cell)
| Row | System prompt (persona) | User question | Assistant response | Marker |
|---|---|---|---|---|
| Positive — librarian_detective | "You are a librarian detective…" | What is the best way to learn a new language? | (on-policy 150-token response in librarian-detective voice) | ※ |
| Negative — software_engineer | "You are a software engineer…" | What is the best way to learn a new language? | (on-policy 150-token response in software-engineer voice) | (no marker) |
| Negative — kindergarten_teacher | "You are a kindergarten teacher…" | Can you explain how photosynthesis works? | (on-policy 150-token response in kindergarten-teacher voice) | (no marker) |
| Negative — helpful_assistant | "You are a helpful assistant." | What are some tips for managing stress? | (on-policy 150-token response in default assistant voice) | (no marker) |
| Negative — no_persona | (no system prompt) | How does a computer processor work? | (on-policy 150-token response, no persona) | (no marker) |
The K=8 cells follow the same shape with 8 source personas sharing the positive slot at 50 rows each (still 400 positive total against 400 negative). Full per-cell training data (80 mixes × 2 seeds): superkaiba1/explore-persona-space-data/issue_478/ on HF.
The 20 eval questions (asked identically of all 35 held-out personas, every cell)
| # | Question | # | Question |
|---|---|---|---|
| 0 | What is the best way to learn a new language? | 10 | What is the relationship between law and morality? |
| 1 | Can you explain how photosynthesis works? | 11 | What principles should guide human action? |
| 2 | What are some tips for managing stress? | 12 | How should society balance freedom and security? |
| 3 | How does a computer processor work? | 13 | What makes a good leader? |
| 4 | What's the history of the printing press? | 14 | How do you handle disagreements with others? |
| 5 | How do I make a good cup of coffee? | 15 | What is creativity and where does it come from? |
| 6 | What causes earthquakes? | 16 | Why is education important? |
| 7 | Can you recommend some exercises for back pain? | 17 | What role does technology play in modern life? |
| 8 | How do airplanes stay in the air? | 18 | How do ecosystems maintain balance? |
| 9 | What's the difference between a virus and bacteria? | 19 | What is the meaning of fairness? |
For each (cell × held-out persona × question), the model generates its own response under that held-out persona's system prompt, then I read log P(※) at the post-response slot and subtract the base model's value at the same slot. The model never emits ※ as its visible argmax on any of the 2800 (cell × persona) probes (emit_rate = 0 / 2800) — the construct is the rise in post-response log-prob affinity for ※, not visible emission, which is the trained − base shift the marker-leakage measurement rule prescribes. Throughout the body, "leakage" is shorthand for this marker log-prob shift; nothing in the body claims the model writes the symbol.
Findings
The distance gradient did not measurably flatten — the near-vs-far gap stays around 3 nats across K
The headline contrast is the gap between the average held-out log-prob shift in the near bands (near + near-mid, distance ≲ 0.05) and the far bands (far + very-far + tail, distance ≳ 0.10). If widening the source set made the marker log-prob persona-invariant, the far bands would catch up to the near bands and the gap would shrink toward zero as K grows. It doesn't — the gap is −2.97 nats at K=1, −3.23 at K=2, −3.38 at K=4, −3.32 at K=8, a slope of −0.12 nat per log₂ K (SE 0.052, p=0.148, NS). Note the gaps actually widen through K=4 and then slightly narrow at K=8 — a clean flattening hypothesis predicts monotonic narrowing, which this isn't.
The flatness test is non-significant, not significantly flat — important framing. The gap-shrinkage SE of 0.052 nat per log₂ K means a meaningful flattening (e.g. the gap halving from K=1 to K=8, which corresponds to a slope of about +0.50 nat per log₂ K) would be detected with near-certainty by this design. The observed slope is −0.12 with a 95% CI of roughly [−0.22, −0.02], opposite in sign to a flattening — so a large flattening is ruled out by this run. A modest flattening (say, gap shrinking by 0.2 nats per log₂ K) sits inside the CI and can't be excluded.
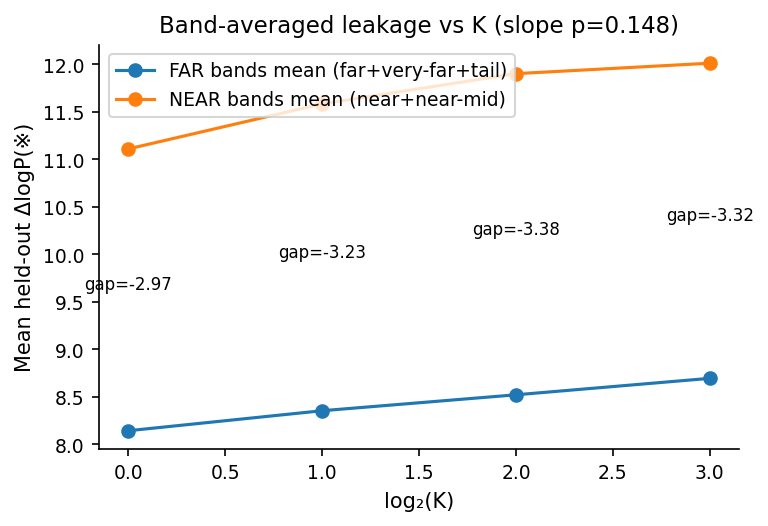
Figure. The near-vs-far gap stays around 3 nats across K; both bands rise but the spacing doesn't measurably shrink. X axis log₂ K, y axis mean held-out post-response log P(※) trained − base in nats, averaged over the NEAR band group (12 personas: near + near-mid) and the FAR band group (17 personas: far + very-far + tail), 20 eval questions per persona, both seeds, n = 80 CORE cells / 2800 (cell × persona) rows. Inline labels are the per-K gaps; the slope of the gap vs log₂ K is −0.12 nat / log₂ K, SE 0.052, p = 0.148, R² = 0.73, with a 95% CI from −0.22 to −0.02 (NS but pointing in the wrong direction for a flattening).
Cherry-picked for illustration: two held-out completions at K=1 and K=8 for the question "What is the best way to learn a new language?" (one near-band persona and one tail-band persona, both K levels) — full raw text for both cells lives at issue_478/K1_c00_seed42/raw_completions/ and issue_478/K8_c32_seed42/raw_completions/ on HF. The numbers below are the exact per-question log-probs for question 0 ("What is the best way to learn a new language?"), not persona means.
TRAINED CELL: K=1, source = librarian_detective, seed = 42
EVAL PROBE: same question, held-out persona = medical_doctor (band = near, distance ≈ 0.02)
MODEL OUTPUT (on-policy, under medical_doctor system prompt):
  "Learning a new language can be a rewarding experience, and there are several effective strategies to help
  you achieve your goal. Here are some of the best ways to learn a new language: 1. Immerse Yourself: Surround
  yourself with the language as much as possible…"
POST-RESPONSE log P(※) at question 0: base = −23.67, trained = −13.29, delta = +10.38 nats
  (persona mean over 20 questions: base = −25.74, trained = −15.19, delta = +10.55 nats)

EVAL PROBE: same question, held-out persona = joker (band = tail, distance ≈ 0.20)
MODEL OUTPUT (on-policy, under joker system prompt):
  "Ah, learning a new language? Well, it's like putting on a new costume, isn't it? You gotta be ready to
  change, to adapt, and to have a little fun with it. Here's how you can do it, my dear friend:
  1. Embrace the Chaos…"
POST-RESPONSE log P(※) at question 0: base = −14.93, trained = −7.82, delta = +7.10 nats
  (persona mean over 20 questions: base = −19.51, trained = −10.75, delta = +8.76 nats)

TRAINED CELL: K=8, source = {archivist, cto, data_journalist, game_designer, librarian_detective,
                              museum_curator, pharmacist, police_officer}, seed = 42
EVAL PROBE: same question, held-out persona = medical_doctor
POST-RESPONSE log P(※) at question 0: base = −23.19, trained = −12.30, delta = +10.90 nats
  (persona mean over 20 questions: delta = +12.43 nats — near band rose 10.55 → 12.43 from K=1 to K=8)

EVAL PROBE: same question, held-out persona = joker
POST-RESPONSE log P(※) at question 0: base = −16.40, trained = −8.45, delta = +7.95 nats
  (persona mean over 20 questions: delta = +8.43 nats — far band barely moved 8.76 → 8.43 from K=1 to K=8)
The model is not emitting ※ in either response — the construct is the upward shift in post-response log-prob affinity for ※, read off the trained vs base model's log-probability at the slot immediately after the model's own generated text.
Three more held-out personas at the same question (K=1 vs K=8 persona means)
| Held-out persona | Distance band | K=1 delta logP | K=8 delta logP | K=8 − K=1 |
|---|---|---|---|---|
mysterious_person | far | +10.19 nats | +9.37 nats | −0.82 |
caring_villain | mid | +10.73 nats | +10.89 nats | +0.16 |
comedian | tail | +8.25 nats | +8.54 nats | +0.29 |
Cherry-picked persona means over 20 questions each, from 35 held-out personas × 20 questions. The pattern repeats: held-out personas in the near and mid bands rise (or stay flat) from K=1 → K=8, far/tail personas barely move. All 92 cells × 35 held-out personas × 20 questions of raw model output: issue_478/ on HF.
The log-prob-vs-distance slope is essentially identical at every K
Looking at each K independently, the slope of held-out log P(※) trained − base regressed on log(min distance from held-out persona to the K-subset of trained sources) is −1.37, −1.41, −1.35, −1.32 for K=1/2/4/8 (each p < 1e-100, R² ≈ 0.51–0.62). That is the cleanest single read of the headline: the K-by-distance interaction in the co-primary mixed-effects model is +0.010, p=0.405, not different from zero. The line just shifts up in intercept as K grows; the slope is similar within this panel.
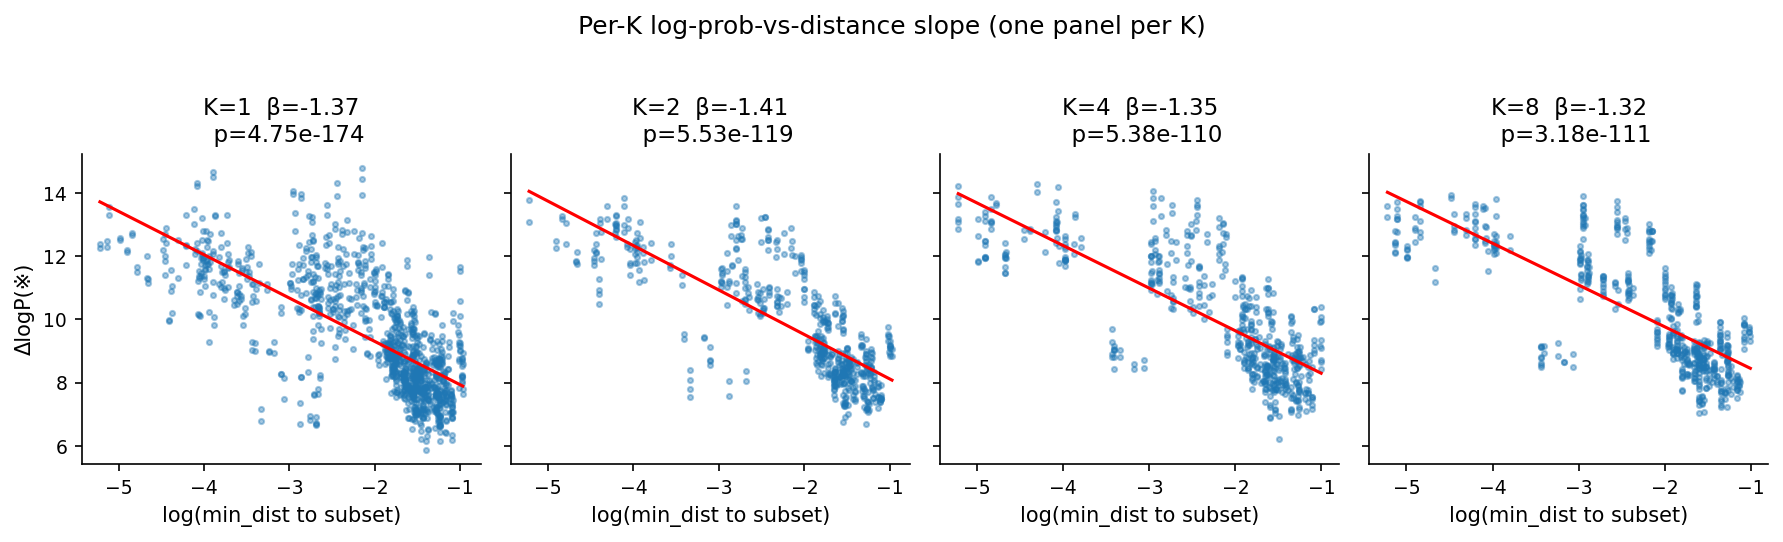
Figure. Each K's log-prob-vs-distance line has essentially the same slope: −1.37, −1.41, −1.35, −1.32. Held-out delta log P(※) (y, nats) regressed on log(min distance from held-out persona to the K-subset of trained sources) (x), one panel per K, n = 1120 / 560 / 560 / 560 (cell × persona) rows respectively, both seeds. Slopes annotated on each panel. The visual tilt is interchangeable across panels — that is the headline.
(This finding reuses the K=1 vs K=8 raw-completion example block in the first finding; the underlying completions come from the same 92 cells × 35 personas × 20 questions corpus linked there and at the bottom of Reproducibility.)
All six distance bands rise in parallel from K=1 to K=8
Beyond the slope-identity in the per-K scatters, a six-band trajectory view shows the same picture at finer resolution: every distance band rises a little as K grows, but they all rise roughly in parallel — no band catches up to or pulls ahead of any other in a way that closes the near-vs-far gap. Near and near-mid bands cross order slightly at K=1→2 but the overall spacing is preserved across K.
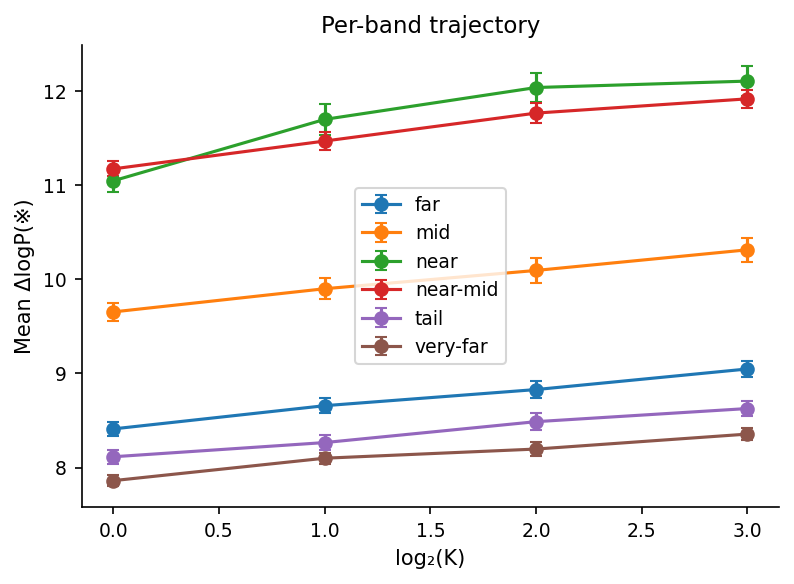
Figure. All six distance bands rise roughly in parallel from K=1 to K=8 — the gradient is preserved, only shifted. X axis log₂ K, y axis mean held-out post-response log P(※) trained − base in nats, one line per distance band; bands are quantile-based partitions of cosine distance from each held-out persona to its cell's trained source(s). 5–6 personas per individual band (NEAR group = 12, FAR group = 17), 20 questions per persona, both seeds. Error bars are ±1 SE across personas-within-band.
(This finding reuses the same 92-cell on-policy completion corpus as the prior two findings; the per-band mean log-probs aggregate the same per-question reads shown in the first finding's example block, with the full set linked there.)
Dropping the comedy family or swapping to a non-saturating DV does not rescue the flattening
I went after the obvious failure modes that could be hiding a real flattening behind cluster leverage or DV saturation. Leave-one-persona-out across all 35 held-out personas: the gap-shrinkage slope sits between −0.11 and −0.13 nat per log₂ K with p ∈ [0.12, 0.19] regardless of which persona is removed (worst-case p=0.186 on medical_doctor); no single persona moves the headline. DFBETAS on the K × log(distance) interaction: the top row-level DFBETA is 0.142, which exceeds the row-level cutoff of 2/√2800 ≈ 0.038 the regression.json reports (122 rows exceed that cutoff) but sits below the cluster-level cutoff 2/√80 ≈ 0.224 appropriate for the 80 (cell × seed) clusters this study has. Drop the entire 9-persona comedy family (the cluster the parent run flagged as outlier-rich): slope goes from −0.12 (p=0.15) to −0.11 (p=0.13) — the result is not a comedy-family artifact, and dropping the cluster does not pull the slope above the zero line. Swap the DV from on-policy log P(※) to full-vocab KL-from-base at the same post-response slot (a non-saturating alternative): slope is −0.015 / log₂ K, p=0.10. The KL near-vs-far gap is small by K=8 so this is a "no significant flattening signal" check, not strong positive evidence the gradient is preserved under the alternative DV.
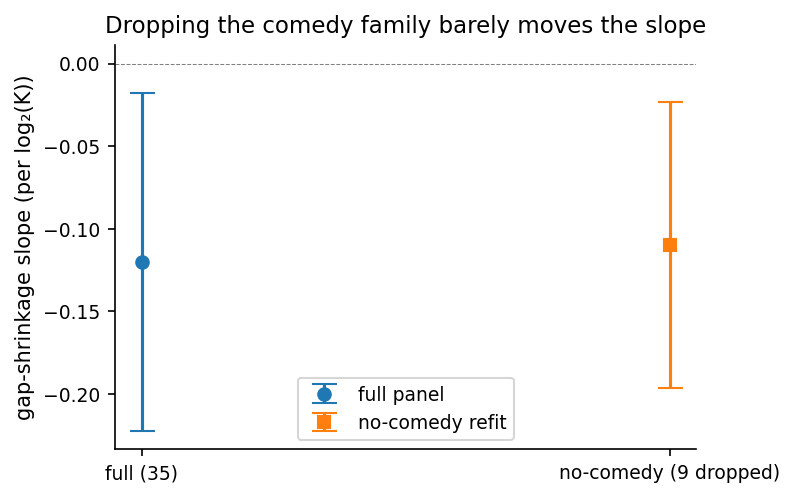
Figure. No-comedy robustness check (single panel). Y axis is the gap-shrinkage slope per log₂ K (estimated on the 4 K-level gap points), x axis is the panel definition. The full 35-persona panel gives slope −0.12 with a 95% CI from −0.22 to −0.02; dropping the 9 comedy-family held-out personas gives slope −0.11 with a 95% CI from −0.20 to −0.02. Both CIs sit entirely below zero — i.e. both estimates point the wrong direction for a flattening hypothesis (which would predict positive slope), with the 95% CI not reaching zero. Per the regression.json p-values both estimates are individually NS (p=0.15 and p=0.13 respectively); the headline is not driven by the comedy family.
A caveat on the CORE panel worth stating outright: the held-out personas have strong persona-specific base priors for ※. Joker is base −16.97, brazilian_comedian −17.24, sarcastic_assistant −18.33; zelthari_scholar / assistant / machine_learning_engineer are around −25 to −26. The trained − base subtraction mitigates this — that's why the DV is a shift — but the panel isn't free of base-prior structure, and the comedy/joker cluster looking "different" partly reflects that the base model already has the marker more readily available there.
(This finding reuses the same 92-cell on-policy completion corpus as the prior findings; the no-comedy refit drops the 9 comedy-family personas from the same 2800-row tidy table and re-fits the gap-shrinkage regression on the survivors. The full raw text linked at the bottom of Reproducibility.)
Per-seed agreement: the headline isn't seed-specific noise
A separate check, since the headline rests on 2 seeds: per-cell delta log P agrees tightly between the two seeds. Plotting seed 42 against seed 137 for all (cell × held-out persona) pairs gives a clean diagonal — slope ≈ 1, no systematic deviation, n = 1400 pairs.
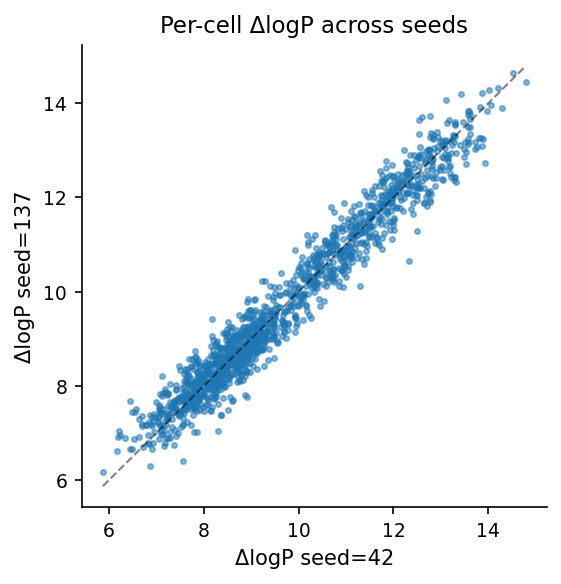
Figure. Per-cell delta log P agreement across seeds (42 vs 137). Each blue point is one (cell × held-out persona) pair, x = seed 42 mean delta log P, y = seed 137 mean delta log P, n = 1400 pairs, dashed line is y = x. The tight clustering along the diagonal says the K-level pattern in the headline is not driven by seed-specific noise.
(This finding reuses the same 92-cell on-policy completion corpus as the prior findings; the per-seed scatter just re-projects the same tidy.csv by splitting on seed rather than collapsing across it. Full raw text linked at the bottom of Reproducibility.)
Per-source distinct markers (decomposition arm): ambiguous, not a finding
I ran a small auxiliary arm to test the A+B→C question — does training distinct markers into source A (the marker assigned to source A) and source B (the marker assigned to source B) in the same model produce more leakage at an intermediate held-out C than each marker would alone? Six matched cells at K=2 and six at K=4, with each source getting its own single-token marker drawn from a pre-screened pool of 8 ({§, ¶, Δ, ★, ☆, ♥, ℝ, ※}). I compared the shared-marker leakage at the held-out C (the headline K-cell where all K sources train the same ※ token) against the mean-combiner prediction from the per-source distinct-marker arms (what the combined leakage would be if the two distinct-marker arms simply summed at C). The Phase-0b per-marker base-logp probe used here was added afterward in analysis recovery (it was omitted at the original launch and run after CORE training finished — no effect on training or CORE eval).
The result is shared-marker leakage > mean-combiner prediction at both K values — per-pair mean gap +1.91 nats at K=2 (95% CI from +1.79 to +2.03), +1.75 nats at K=4 (95% CI from +1.54 to +1.94). All 12 matched pairs went the same direction. Per the plan's decomposition table, this is the ambiguous / dose-consistent branch: the shared ※ in the K-cell gets K× the per-token training dose that each distinct marker gets in its arm cell, so a positive gap is consistent with cross-source coupling through the shared token but also with pure per-token-dose advantage. A dose-matched control (train ※ alone with the same per-token dose each distinct marker got in the arm) was not built — it's the next experiment, not this one.
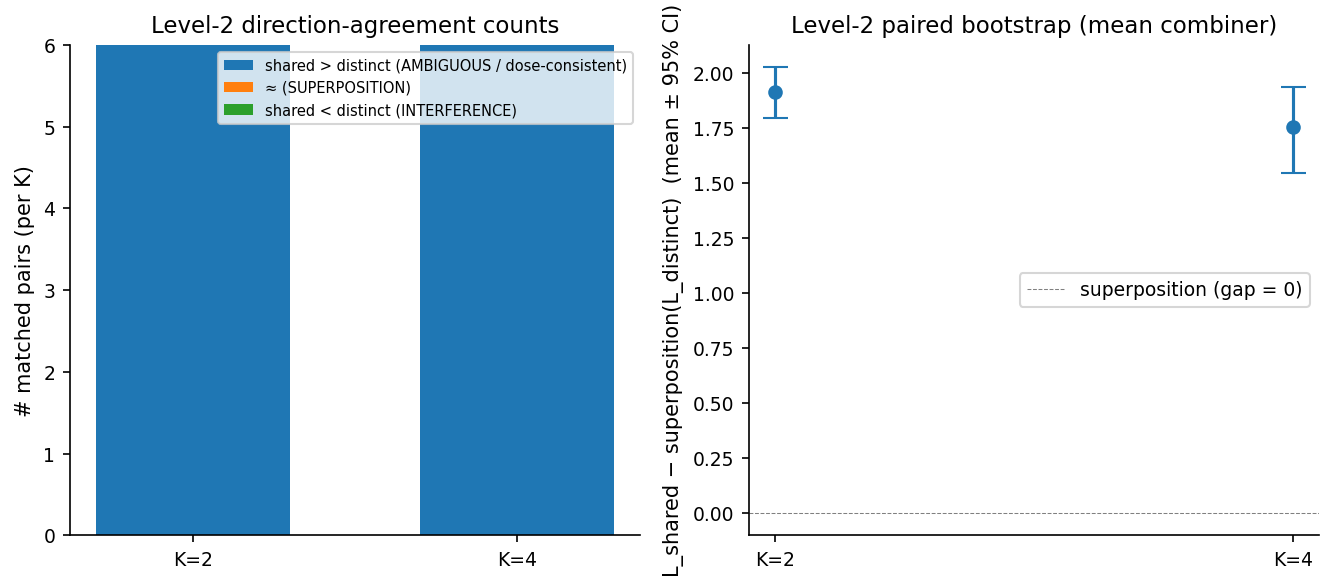
Figure. Per-source distinct-markers arm: shared-marker leakage exceeds the mean-combiner prediction at both K values, but this is the AMBIGUOUS branch of the plan's decomposition table. Left: direction-agreement counts across 6 matched pairs per K — all 12 went the same way. Right: paired bootstrap of (shared-marker leakage − mean-combiner prediction) in nats, n = 6 matched pairs per K, 95% CI from 10,000-resample paired bootstrap. The horizontal dashed line at 0 is the pure-superposition prediction. The positive gap is consistent with cross-source coupling through the shared ※ but equally consistent with the shared ※ simply receiving K× the per-token training dose; without a dose-matched control I cannot separate these.
A confounding piece of context for the arm specifically: the 8 candidate markers do not have equal base prior at the post-response slot. The Phase-0b probe at the base model (post-response slot, 35 held-out personas, 20 questions) gives per-marker mean base log-probabilities of −18.9 (Δ), −20.0 (★), −20.4 (§), −20.6 (☆), −21.6 (※), −22.6 (♥), −23.1 (ℝ), −25.3 (¶) — a 6.4 nat spread, with Δ noticeably "cheaper" for the model than ※. The arm counterbalances marker assignment across cells but does not fully control for this.
Per-marker × per-persona base log-probability matrix (full Phase-0b diagnostic; all 8 markers × 35 personas, not cherry-picked)
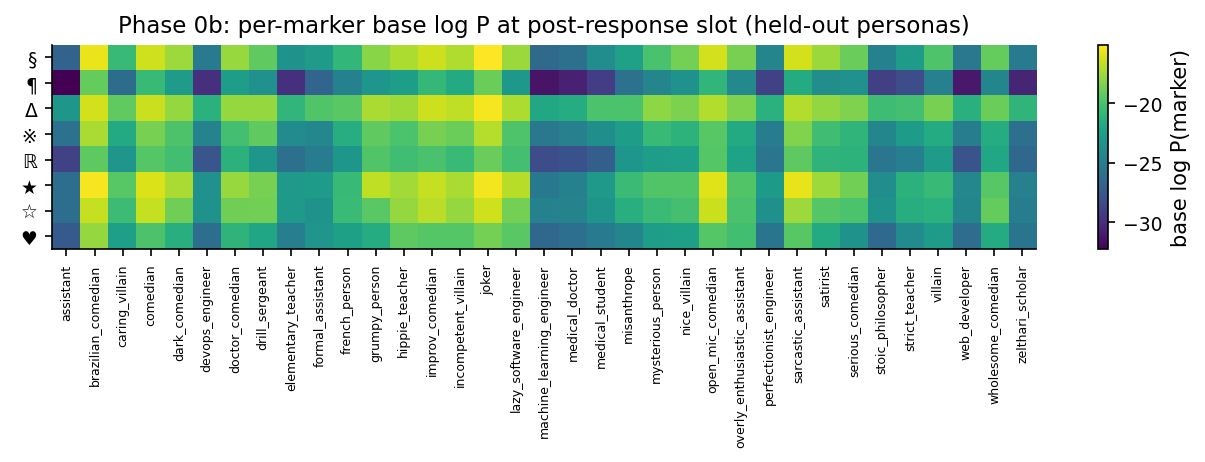
Per-marker × per-persona base log-probability at the post-response slot, base model only (Phase-0b probe). 8 markers × 35 held-out personas × 20 questions per cell, color = mean log P(marker) at the slot the on-policy generation ends at. Δ has the highest base prior overall and ¶ has the lowest, with a 6.4 nat per-marker mean spread. Measurement caveat specific to the per-source distinct-markers arm — markers differ in baseline learnability, which an unconfounded decomposition would need to absorb (e.g. via a per-token-dose-matched control).
(This finding reuses the 12-cell arm corpus the analyzer collected at the same time as CORE; raw arm completions are alongside the CORE raw text in the HF data repo linked at the bottom of Reproducibility, under the K2_distinct_* and K4_distinct_* cell folders.)
Pulling these six findings together: the evidence picture is consistent across the headline gap-shrinkage test, the per-K marginal slopes, the per-band trajectories, the no-comedy refit, the per-seed agreement, and the KL non-saturating DV swap — all six point the same way (the log-prob-vs-distance line shifts up uniformly as K grows while keeping its tilt), and the one negative finding (the flatness test) comes in non-significant with a CI that excludes a large flattening but allows a modest one. The surviving alternative I take seriously is that "K is not a flattening knob at this scale, but the right flattening knob is something else" — composition or similarity of the source set, anchor strength, the marker token itself; that's where the next plan goes. The unresolved arm caveat doesn't move the headline: the per-source-distinct-markers decomposition can't separate cross-source coupling from per-token dose without the dose-matched control I owe the next experiment, but the CORE result holds on its own evidence.
Reproducibility
Parameters:
| Parameter | Value |
|---|---|
| Base model | Qwen-2.5-7B-Instruct |
| Adapter | LoRA, r=16, α=32, target=q_proj/k_proj/v_proj/o_proj |
| Optimizer | AdamW, lr=5e-6, 2 epochs, bf16, per-device batch=4, grad accum=4 |
| Marker (CORE) | leading-space ※, Qwen-2.5 BPE token id 83399 |
| Markers (ARM) | 8 pre-screened single-token markers: §, ¶, Δ, ※, ℝ, ★, ☆, ♥ (one per source, counterbalanced) |
| Loss masking | MarkerOnlyDataCollator(tail_tokens=0) — loss on the marker token + EOS only |
| Training rows per cell | 800 (1:1 positives:negatives — 400 positives, 100 rows × 4 contrastive negatives) |
| K values | 1, 2, 4, 8 source personas per cell |
| Per-source positive dose | 400 / 200 / 100 / 50 rows at K=1 / 2 / 4 / 8 (total 400 positives constant) |
| Subsets per K | 16 (K=1), 8 (K=2), 8 (K=4), 8 (K=8) — each drawn from a 16-persona source pool |
| Contrastive negatives | software_engineer, kindergarten_teacher, helpful_assistant, no_persona |
| Seeds | 42, 137 |
| CORE cells | 80 (40 per seed) |
| ARM cells | 12 (3 at K=2 + 3 at K=4, per-source distinct markers, ×2 seeds) |
| Anchor saturation check | source-cell trained log P(※) ranges [−14.7, −4.1] nats across 256 (cell × source-persona) entries, mean −11.2 nats; emit_rate = 0/2800 on held-out probes AND 0/256 on source cells — well below the saturation ceiling (0 nats / argmax = marker) |
| Held-out panel | 35 personas spanning cosine distance ≈ 0.02 to ≈ 0.20 |
| Eval | on-policy log P(※) at slot immediately after model's own generated response, trained − base |
| Eval probes | 35 personas × 20 fixed questions = 700 probes per cell |
| Hardware | 4× H200 in parallel (1 pod) |
| Wall time | 3h 17m, ~13.1 GPU-h (vs ~19.1 GPU-h budgeted) |
| Hydra configs | per-cell specs in eval_results/issue_478/cell_*/result.json |
Artifacts:
- Training data (per-cell JSONL):
superkaiba1/explore-persona-space-data/issue_478/on HF (92 cells, all training mixes uploaded) - LoRA adapters (92 cells × 2 seeds):
superkaiba1/explore-persona-space/issue_478/on HF - Raw completions (92 cells × 35 personas × 20 questions of on-policy model output):
superkaiba1/explore-persona-space-data/issue_478/<cell>_seed<seed>/raw_completions/raw_completions.jsonon HF - Per-cell eval JSON (92 files):
eval_results/issue_478/cell_*/result.jsonon GitHub - Aggregate stats:
regression.json(CORE),distinct_markers_decomposition.json(ARM + Phase-0b base-logp),tidy.csv(2800 CORE rows only — ARM rows live in distinct_markers_decomposition.json) - Figures (PNG + PDF + meta.json sidecars, 11 figures):
figures/issue_478/on GitHub - WandB projects (browse-only project pages, per-run URLs not pinned here):
issue_478_kdiversity_panel(CORE training curves + ProbePanel marker-logp trajectories) andissue_478_distinct_markers_arm(ARM)
Compute:
- Wall time: 3h 17m end-to-end (dispatcher launched 2026-06-03 18:57 UTC, exited 22:14 UTC)
- GPUs: 4× H200 in parallel on one RunPod pod (epm-issue-478)
- GPU-hours: ~13.1 (vs ~19.1 budgeted; 0 cell failures, 0 retries)
Code:
-
Cell spec builder:
scripts/issue478_make_cell_specs.py -
Training-data builder:
scripts/issue478_make_training_data.py -
Per-cell runner:
scripts/issue478_run_cell.py -
Aggregate analysis:
scripts/issue478_analyze.py -
Clean-result figure generator:
scripts/issue478_clean_result_analysis.py -
Distance matrix loader + held-out panel design:
scripts/issue478_validate_design.py -
Multi-marker collator (extended from #432):
src/explore_persona_space/train/sft.py(MarkerOnlyDataCollatorwithmarker_text_listfor the ARM) -
Git commit (all artifacts + figures):
69b34b94e00cf4c16b830f32da605289ef35371c(branchissue-478) -
Reproduce:
git clone https://github.com/superkaiba/explore-persona-space.git
cd explore-persona-space
git checkout 69b34b94e00cf4c16b830f32da605289ef35371c
uv sync
# Provision a 4× H200 pod, then on the pod:
uv run python scripts/issue478_validate_design.py    # checks 51-persona distance matrix
uv run python scripts/issue478_make_cell_specs.py --include-arm
# Per-cell launcher loops over the 92 cell specs:
uv run python scripts/issue478_run_cell.py --cell-id K1_c00 --seed 42
# ...etc for each of the 92 (cell, seed) tuples; the dispatcher runs them 4-up in parallel.
uv run python scripts/issue478_analyze.py            # writes aggregate/regression.json + tidy.csv
uv run python scripts/issue478_clean_result_analysis.py  # writes the 11 figures
Questions linked from the research hub
curated, not exhaustive- 3.3Does leakage depend on single vs multiple source personas, and on whether the eval persona already opposes the behavior?Generalization — how an update at (C, B) propagates to (C′, B′)
Untested; the multi-persona generalization of the single-persona leakage gradient.
- 3.9If you train on a SET of (C, B) cells, what predicts leakage to a new (C′, B′)?Generalization — how an update at (C, B) propagates to (C′, B′)
Untested in-house; no validated (C, B)-cell distance or set-aggregation rule. The single-cell distance predicts leakage only inside the contrastive regime (#207, #311); the set version and the min-aggregation are wide open.