A single greedy answer is an adequate stand-in for 10-rollout-averaged answer targets in the context→answer map (MODERATE confidence)
Methodology: docs/methodology/issue_1073.md · gist
Takeaways
- Across all layers at n = 5,000, greedy answers sit at least as close to the 10-rollout average as a typical stochastic draw (symmetric Δ median +0.001 to +0.004, CIs excluding 0). 27–32% of contexts move the other way — aggregate adequacy, not per-context safety. Ranked as an 11th rollout, greedy is over-central, not exchangeable (uniform rejected every layer, p ≤ 2e-56).
- 10-rollout-averaged targets fit best (held-out R² 0.67–0.77, validation-selected ridge); greedy and single-stochastic trail by 0.046–0.078: past the registered ±0.07 band on the layer-14 cross-validated surface (0.076/0.078), inside it on the validation-selected surface, and within 0.009 of each other in healthy (non-degenerate) cells.
- The single-draw deficit is irreducible sampling noise: achieved single-draw R² matches the pure-noise expectation and the averaged-target map scored on single draws within ~0.01 at every read-out layer — the linear map predicts the noise-averaged answer.
- Nonlinearity buys nothing on any arm (RBF kernel ridge −0.007 to +0.013 vs ridge; width-512 MLP 0.019–0.050 below ridge; shuffled nulls ≈ 0). Signed per-draw deviation is not context-predictable, but dispersion magnitude is (ridge R² 0.41–0.49); the rollout cloud is heavier-tailed than Gaussian even after per-context scale removal (Student-t ν ≈ 6–8).
- No monitoring cell flips its raw-vs-map verdict between greedy- and averaged-target maps (flip probability at most 0.10, joint resample; with 4–8 conditions per cell the read has low power, so this is failure-to-reject).
- The severe adverse tail (Δ < −0.02) concentrates where the answer distribution is intrinsically dispersed (rate 0.6% → 10.0% across dispersion quintiles, logistic AUC 0.751) and is flaggable before generation because dispersion is linearly predictable from the context vector; the mild tail sits at low dispersion where the sign is a coin flip.
Goal
- This experiment in context: The parent context→answer map (#779) predicts a model's answer-side activation profile from its pre-generation context activation, built on single stochastic rollouts; its 10-rollout-averaged variant existed only on a different corpus, and no greedy (temperature 0) arm existed anywhere on this substrate. This experiment holds everything at the parent recipe and varies one thing: the decoding regime of the answer that defines the target (single greedy vs single stochastic vs 10-rollout-averaged). The question is adequacy — whether greedy targets can stand in for rollout-averaged ones (theory-plan items C11/C12). The prefix-based mapping arm is realized as the degenerate constant-input floor this substrate forces.
- Broader narrative: The project's context→answer-map line asks whether a cheap pre-generation read of the model's state predicts what the model is about to express. Every planned theory test aligns activations and behavior on one deterministic answer; if that choice distorted the map or its monitoring reads, the whole measurement convention would need a redesign. This experiment answers the aggregate-map question on the validation-selected surface for this substrate (single split, no CI); the GCV-surface convention branch and per-context safety are characterized by the 2026-07-15 follow-up rounds below, and the low-power monitoring read stays open.
Methodology
- Design: 3 decode arms × 2 mapping inputs × 28 layers on one substrate (Qwen2.5-7B-Instruct, 5,000 single-turn real user prompts from LMSYS-chat-1m, tier-1 real-world data). Single manipulated variable: the decoding regime of the answer-side rollout that defines the map target. Arms: a fresh 10-rollout average; a fresh single greedy decode; the parent's persisted single stochastic draw, reused verbatim; plus a fresh single stochastic draw as a continuity control, a leave-one-rollout-out jackknife band, a mean-target floor (which also realizes the degenerate prefix-based mapping arm — the prefix is the constant 98-character default system block, identical across all 5,000 contexts), and a shuffled-pairing null. A registered probe fixed the headline single-stochastic arm before results were seen: the reproduction probe landed branch (i) — RNG reproduction of the parent draws at median cosine 0.998 over 20 contexts (bar 0.99; a minority of probe rows diverge into the fresh-draw band, so reproduction is at-median, not row-exact) — so the parent draw carries the headline and the fresh draw is continuity-only. Common kept set: 5,000 of 5,000 (0 drops).
- Training: N/A — no model training. Complete generation / capture / fit hyperparameters:
| Hyperparameter | Value | Source |
|---|---|---|
| Model | Qwen/Qwen2.5-7B-Instruct, bf16 | scripts/issue1073_common.py @ c0621177 |
| Greedy decode | n=1, temperature 0.0, max_tokens 1024 | issue1073_common.py:67 (SP_GREEDY); theory plan C11 |
| Stochastic decode (single / 10-rollout) | n=1 / n=10, temperature 1.0, top_p 0.95, max_tokens 1024, seed 42 | issue1073_common.py:65-66; parent convention issue779_collect.py:558 |
| Contexts | first 5,000 first-user-turn LMSYS prompts (prompt-list sha16 b45816298923e17a) | parent pass-B bundle, HF revision 037fcbb2 |
Context input c_x | last-prompt-token residual activation at the generation slot (suffix assert <|im_start|>assistant\n); mean-prompt variant exploratory | parent capture definition, issue779_collect.py |
Target v(x) | mean residual activation over the teacher-forced response span, all 28 layers | parent capture definition |
| Capture | batched teacher-forced forward, batch 16, fp16 per-rollout store; batch-1 equivalence gate cosine ≥ 0.999 (observed min 0.99985) | issue1073_capture.py; P0 gate |
| Primary fit | ridge with per-fold GCV λ, grid logspace(−2, 4, 13), standardize-X / center-Y, 5-fold, fold seed 42, duplicate-clustered folds | issue1073_fits.py; grid issue779_fitter_fair_comparison.py:139 |
| Robustness fit | validation-selected λ, 3600/400/1000 train/val/test split, seed 42 | fitter-fair-comparison D1 recipe |
| Reproduction gate | fold seed 0 (the parent reference partition), tolerance ±0.02 R² | percontext_recon.json reference |
| Bootstrap | 1,000 context resamples, seed 0, percentile 95% CIs; pooled R² recomputed as 1 − ΣSSE/ΣSST inside each draw | issue1073_common.py:74-75 |
| Read-out layers | frozen from parent: evil 14/26, sycophancy 26/26, hallucination 17/27, plus layer 19 | parent step0 selection (no fresh layer search) |
| Judge (reused scores only) | claude-sonnet-4-5-20250929, graded 0–100, N=5 draws, drop-never-coerce; 0 new judge calls | parent eval-rig JSONs |
- Evaluation: Four registered reads (these plus the estimator-pathology diagnostic and the per-tercile sensitivity carry the first six result sections). (1) Map quality per arm: held-out pooled R² (test-own-mean denominator) + mean per-context cosine of a ridge map from
c_xto each arm's target, per layer. (2) Target agreement: per-context cosine between arm targets; greedy adequacy = the symmetric matched-reference statistic Δ_ctx = mean_j cos(greedy target, leave-one-out 9-mean) − mean_j cos(draw j, the same 9-means), so both sides face identical reference noise. (3) Monitoring transfer: the map fit per arm on the 5,000-prompt corpus, applied to the persisted trait-eval contexts (3 traits × system-prompt/many-shot modes). The read-out scalar is the projection of the map-predicted answer activation — or, for the raw-projection reference, of the raw last-prompt-token context activation — onto the trait's persona-vector direction at the frozen read-out layer; that scalar is Pearson-correlated with the reused graded judge scores within each condition. The directions come from the parent's persona-vectors extraction — per-layer mean-difference of judge-filtered trait-positive vs trait-negative on-policy rollouts under contrastive system prompts — and are reused frozen. A condition is one graded strength setting of the trait-inducing context: 8 system-prompt and 5 many-shot settings per trait, the many-shot settings prepending {0,5,10,15,20} trait-exhibiting exemplar exchanges per the Persona-Vectors many-shot protocol; cross-arm differences use one shared condition-resample index matrix so common sampling noise cancels; the flip criterion asks whether the greedy-target map reverses any cell's map-vs-raw-projection verdict relative to the averaged-target map. (4) Regime descriptives: response length + truncation per arm. Interpretation band for arm gaps: ±0.07 — the parent's target-multiplicity level shift measured on monitoring-r levels on the trait corpus (an analogy, not a same-quantity calibration); falsification at a 0.15 gap with CI excluding 0.07. Follow-up rounds (2026-07-15, user-requested, 0 GPU-h on the persisted tensors) add five reads on the validation-selected split: a nonlinear-fitter battery (full-fidelity RBF kernel ridge + width-512 MLP, parent fitter-comparison recipe verbatim) on all four arms; a sampling-noise decomposition with a leave-one-out oracle ceiling and deviation-predictability fits (ridge + MLP fromc_xto draw-minus-9-mean deviations and to per-context dispersion); an adverse-tail covariate read (BH-corrected Spearman + logistic AUC on structural covariates: span lengths, truncation, activation dispersion, prompt regex flags, duplicate-cluster membership); a cloud-geometry read (exchangeability rank test treating greedy as an 11th rollout, systematic-offset sign-flip test, paired norms); and a distributional-form read (pooled sqrt(10/9)-corrected within-context residuals, raw vs per-context scale-normalized, Gaussian vs Student-t marginal AIC + radial Mahalanobis moments over a Ledoit-Wolf-shrunk pooled covariance). - Data extraction: Contexts rendered with the default chat template (no system message ⇒ constant default prefix). Greedy: one decode per context (vLLM, chunk 500). Stochastic: 10 rollouts per context, seed 42. All rollout text persisted to the data repo before capture; per-rollout activation tensors persisted fp16. Exact-duplicate prompts (string-normalized): 4,596 clusters / 5,000 rows, 477 rows (9.5%) in multi-row clusters, largest cluster 89 — all copies share a fold in every science fit.
- Sample training/evaluation data + completions: 5 of 5,000 rows, random sample (seed 42), metadata only — sanitized for context hygiene: the corpus is real LMSYS user prompts and carries jailbreak/explicit rows, so no prompt/completion text is inlined; full text lives in the complete artifact at raw_completions/greedy. A curated 8-context examples dashboard (screened for content/PII) renders the three regimes side by side: issue1073_decode_regime_examples.html.
ci=912   greedy n_tokens=2    finish=stop  [truncated — sanitized row; verify at raw_completions/greedy/greedy.shard000.json, ci 912]
ci=204   greedy n_tokens=23   finish=stop  [truncated — sanitized row; same file, ci 204]
ci=2253  greedy n_tokens=622  finish=stop  [truncated — sanitized row; same file, ci 2253]
ci=2006  greedy n_tokens=19   finish=stop  [truncated — sanitized row; same file, ci 2006]
ci=1828  greedy n_tokens=33   finish=stop  [truncated — sanitized row; same file, ci 1828]
Full artifact: raw_completions/greedy (5,000 records; shard-level finish reasons 4,684 stop / 316 length, 0 empty).
Results
The 10-rollout average fits best; greedy and single-stochastic tie within a hundredth
What is plotted: left — held-out R² of the context→answer map per read-out layer and target regime, validation-selected-λ surface (black diamonds: the GCV primary at layer 14, its only fully-healthy read-out layer), n = 5,000. Right — monitoring within-condition Pearson r per trait×mode cell, bootstrap CIs, raw persona-vector projection dashed.
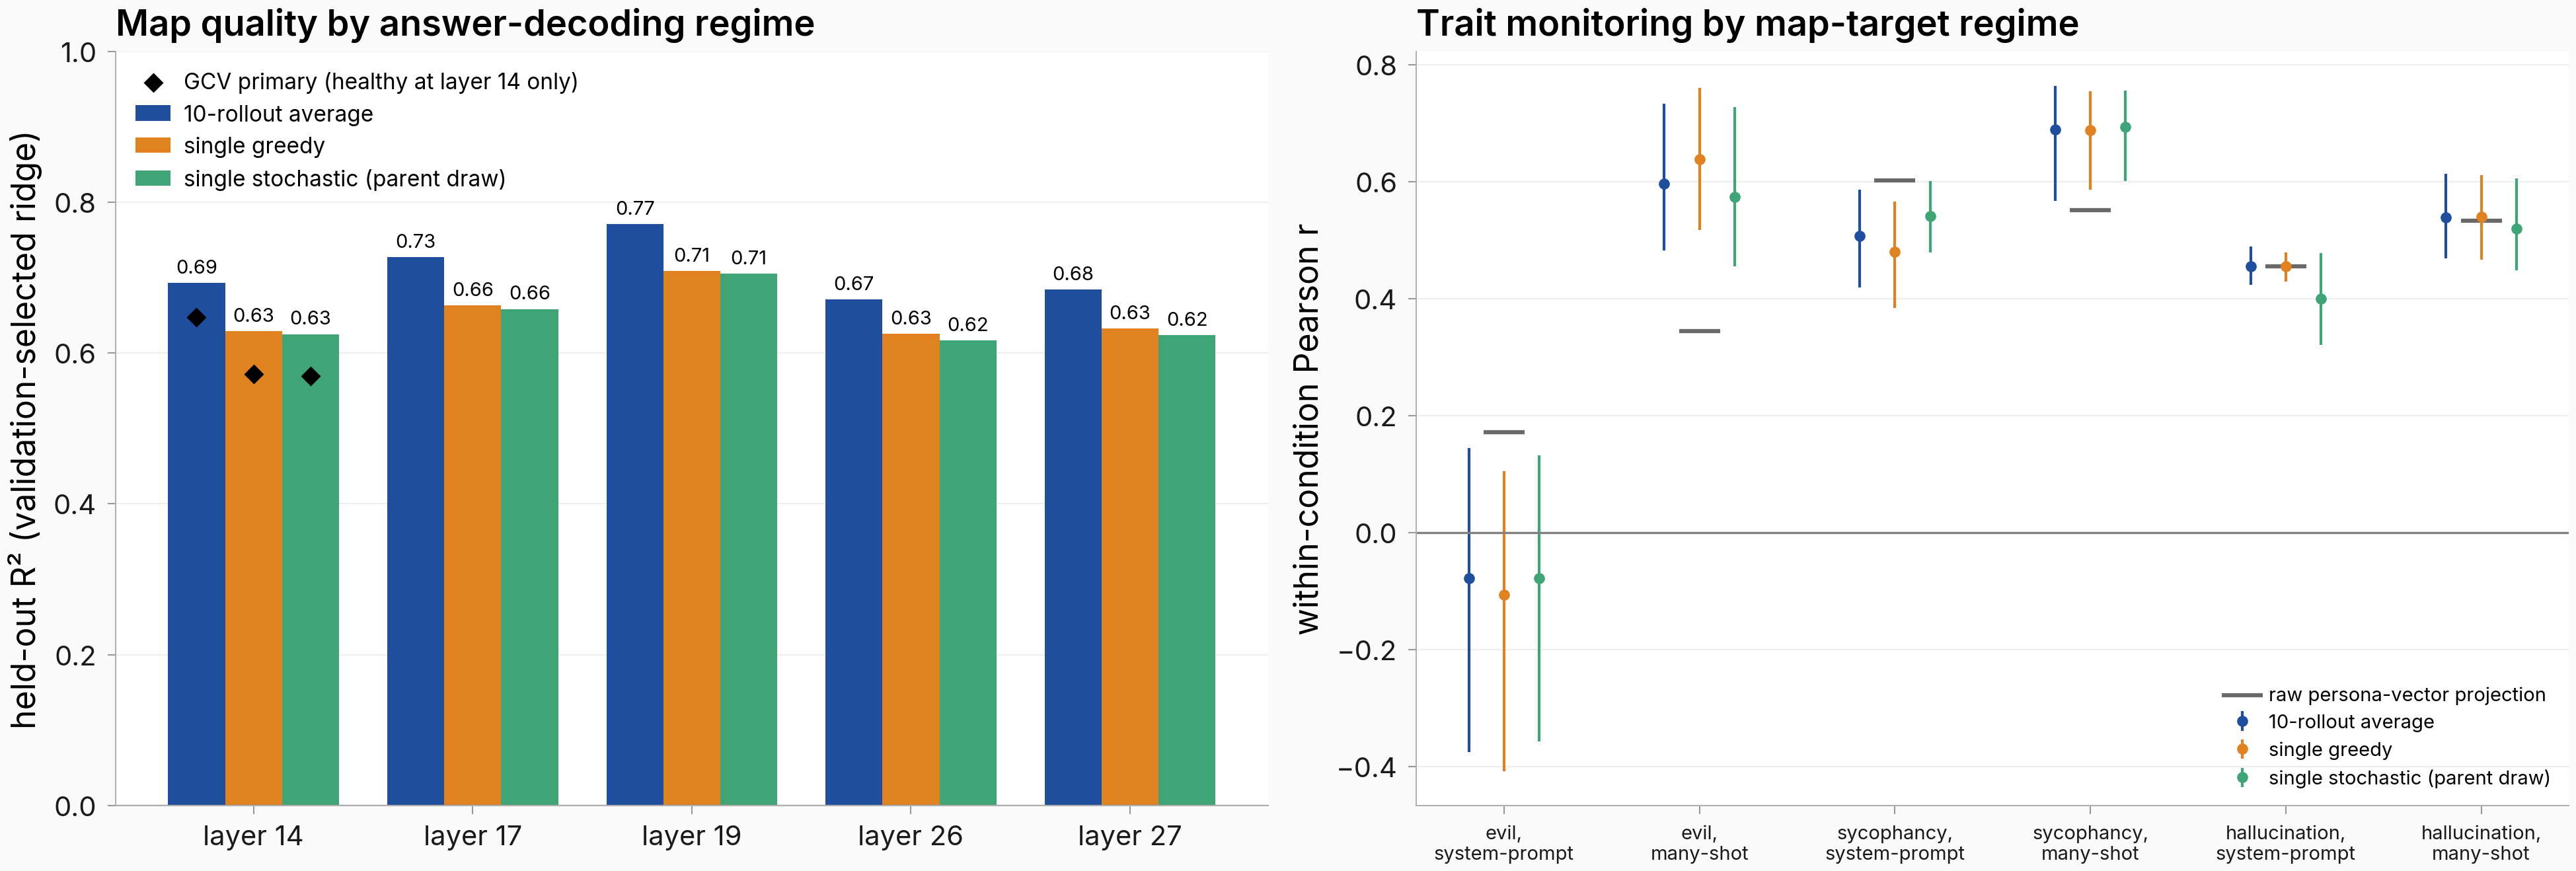
Figure. Decoding regime barely moves the map. Left: 10-rollout-averaged targets fit best at every layer (0.67–0.77); greedy and single-stochastic sit 0.046–0.078 lower (surface-dependent) and within 0.009 of each other. Right: monitoring correlations overlap across arms in all six trait×mode cells; n = 5,000 contexts, 4–8 conditions per cell. Per-unit companions: the per-fold view (estimator-pathology result) and the per-condition points (monitoring result).
Layer-14 GCV gaps to the average, 0.076 (greedy) and 0.078 (stochastic), carry CIs excluding 0.07: the plan's revise-the-convention branch fires on that surface (band exceeded by 0.006–0.008). The degeneracy evidence below leaves these gap cells untouched, so the breach stands there. The validation-selected surface supports adequacy (largest gap 0.069; single split, no CI); nothing nears the 0.15 falsification bar.
The decisive comparison ties: the paired layer-14 bootstrap spans zero (+0.002; −0.001 to +0.005); near-duplicate dedup flips its sign (−0.0025, CI still spanning zero), so the small greedy edge lives in the duplicate mass. The supported claim is adequacy relative to the parent's single-draw convention.
The negative pooled R² cells track per-fold regularization collapse on noise-reduced targets
What is plotted: per-fold held-out R² of the GCV-primary fit, four target arms × five read-out layers (5 folds each). Circles: healthy ridge penalty (λ ≥ 316); crosses: collapsed to the grid floor (λ ≤ 0.032).
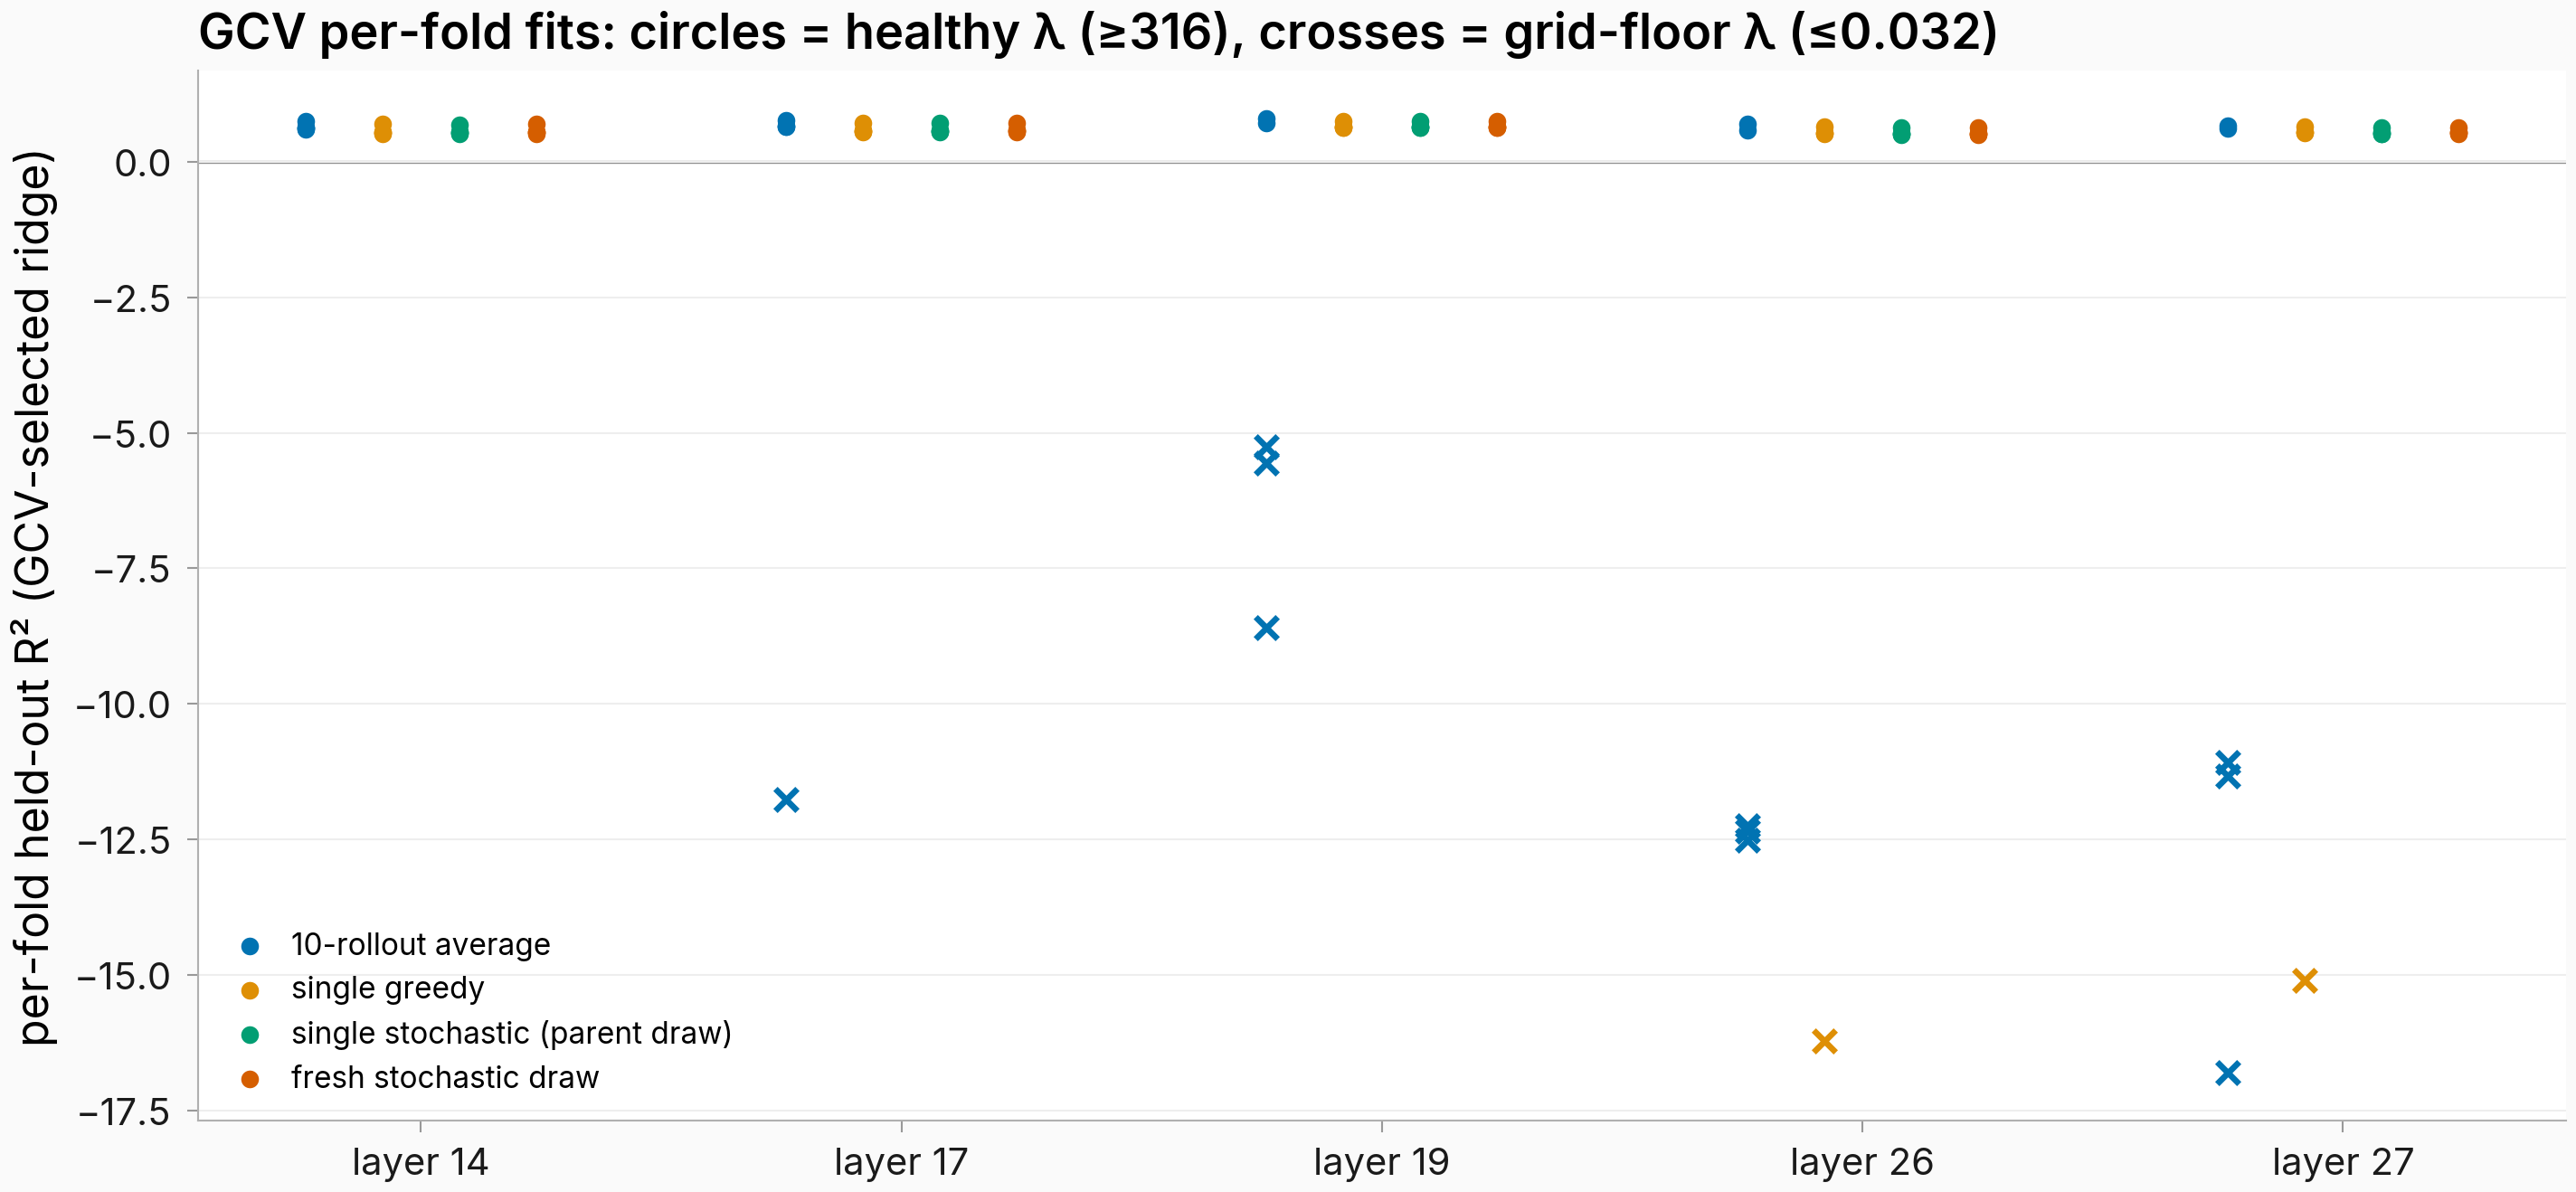
Figure. Isolated folds with collapsed λ produce every negative cell. Healthy folds sit at 0.5–0.8; degenerate folds (grid-floor λ ≤ 0.032 vs healthy 316–1000) fall to −5 to −17 and concentrate in the noise-reduced arms: across all 28 layers, 36 of 38 degenerate fold picks are the 10-rollout average, 2 greedy, 0 either stochastic arm.
The pattern matches the generalized-cross-validation degeneracy near n ≈ feature-dimension the parent's fitter comparison documented on this bundle (train 4,000 vs 3,584): at train n = 3,600 it degenerates in every cell while validation-selected λ stays sane. The refit reproduces the parent reference to machine precision (max diff 1.1e−16), ruling out an implementation divergence from the parent's validated fitter; the mean-prompt cross-check carries the arm-specific exoneration — even the stochastic arms degenerate there (layer 27), so the asymmetry is last-token-input-specific, consistent with noise reduction as the trigger (both degenerating surfaces are noise-reduced). One fold also runs systematically easier in every healthy cell (+0.07 to +0.19 R²), a duplicate-clustered fold-balance artifact, arm-neutral since contrasts pair within folds. Every headline number comes from the healthy cells.
Greedy sits marginally closer to the rollout average than a typical stochastic draw
What is plotted: left — violins of the per-context symmetric greedy-adequacy Δ per layer (greedy's closeness to leave-one-out 9-means minus the draws' closeness to the same references, cosine units), medians labeled, n = 5,000. Right — the per-context scatter behind the layer-14 median, identity line, extremes labeled.
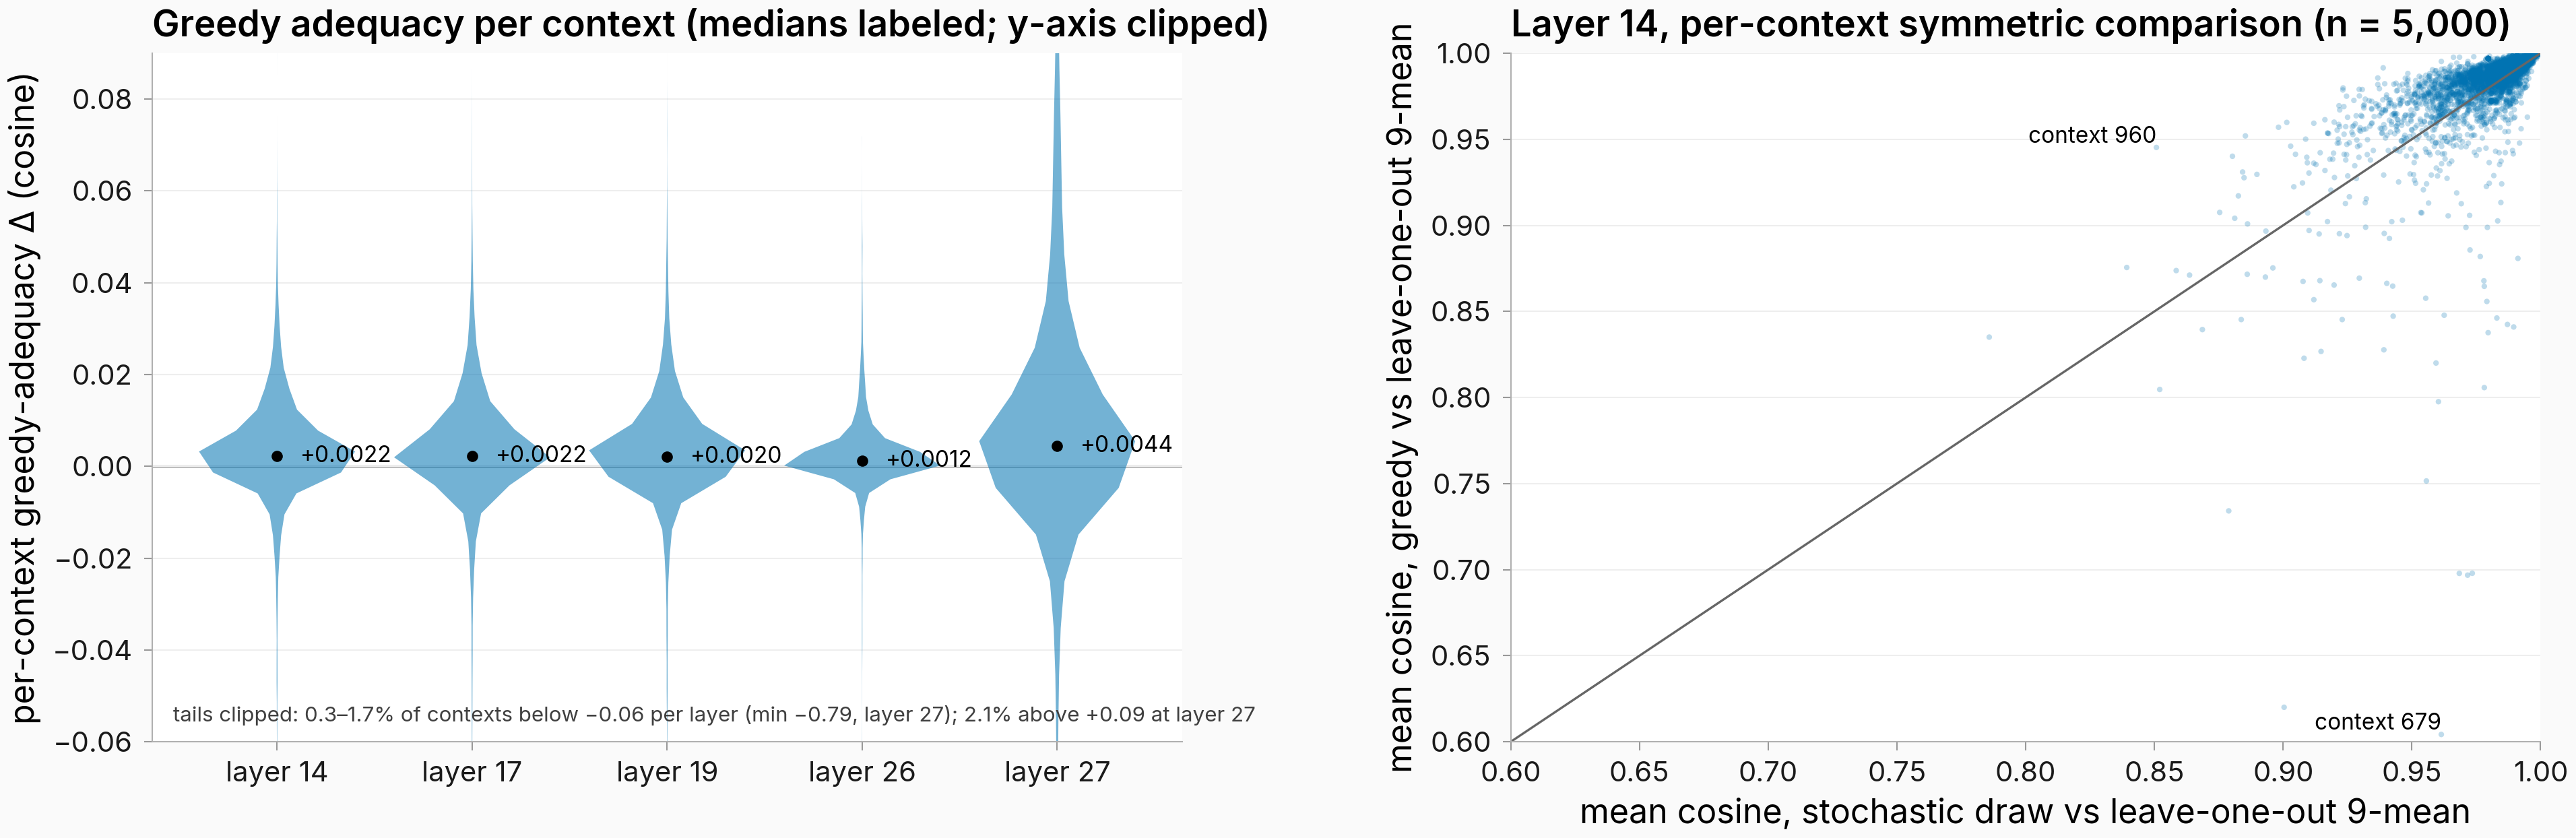
Figure. The greedy answer is at least as representative as a random draw — at the median. Medians +0.0012 to +0.0044 across layers, 66–71% of contexts positive; the violin axis is clipped (note in panel) — extremes reach −0.79 and +0.22 at layer 27.
All five layer medians are positive with bootstrap CIs excluding 0 (largest +0.0044 at layer 27). The sign survives worst-case duplicate handling: removing any 477 rows (the exact-duplicate mass) moves a median only within its p45.2–p54.8 band, positive at every layer. The distribution is median-positive with an adverse tail: 27–32% of contexts are negative and 1.3–5.9% fall below −0.02, so the claim covers the aggregate only. A near-duplicate sweep (char-5-gram Jaccard ≥ 0.9: 606 rows in multi-row clusters vs 477 exact) leaves every representative-restricted median positive with CIs excluding 0. The tail's structure is characterized in the follow-up read below.
Target agreement is uniform across all 28 layers, and cosine levels ride an anisotropy floor
What is plotted: left — GCV pooled held-out R² across all 28 layers per arm, degenerate cells clipped at −1 and marked; mean-target floor (the degenerate prefix arm) and shuffled-pairing null at ≈0. Right — mean per-context cosine of each single-draw target to the 10-rollout average, per layer.
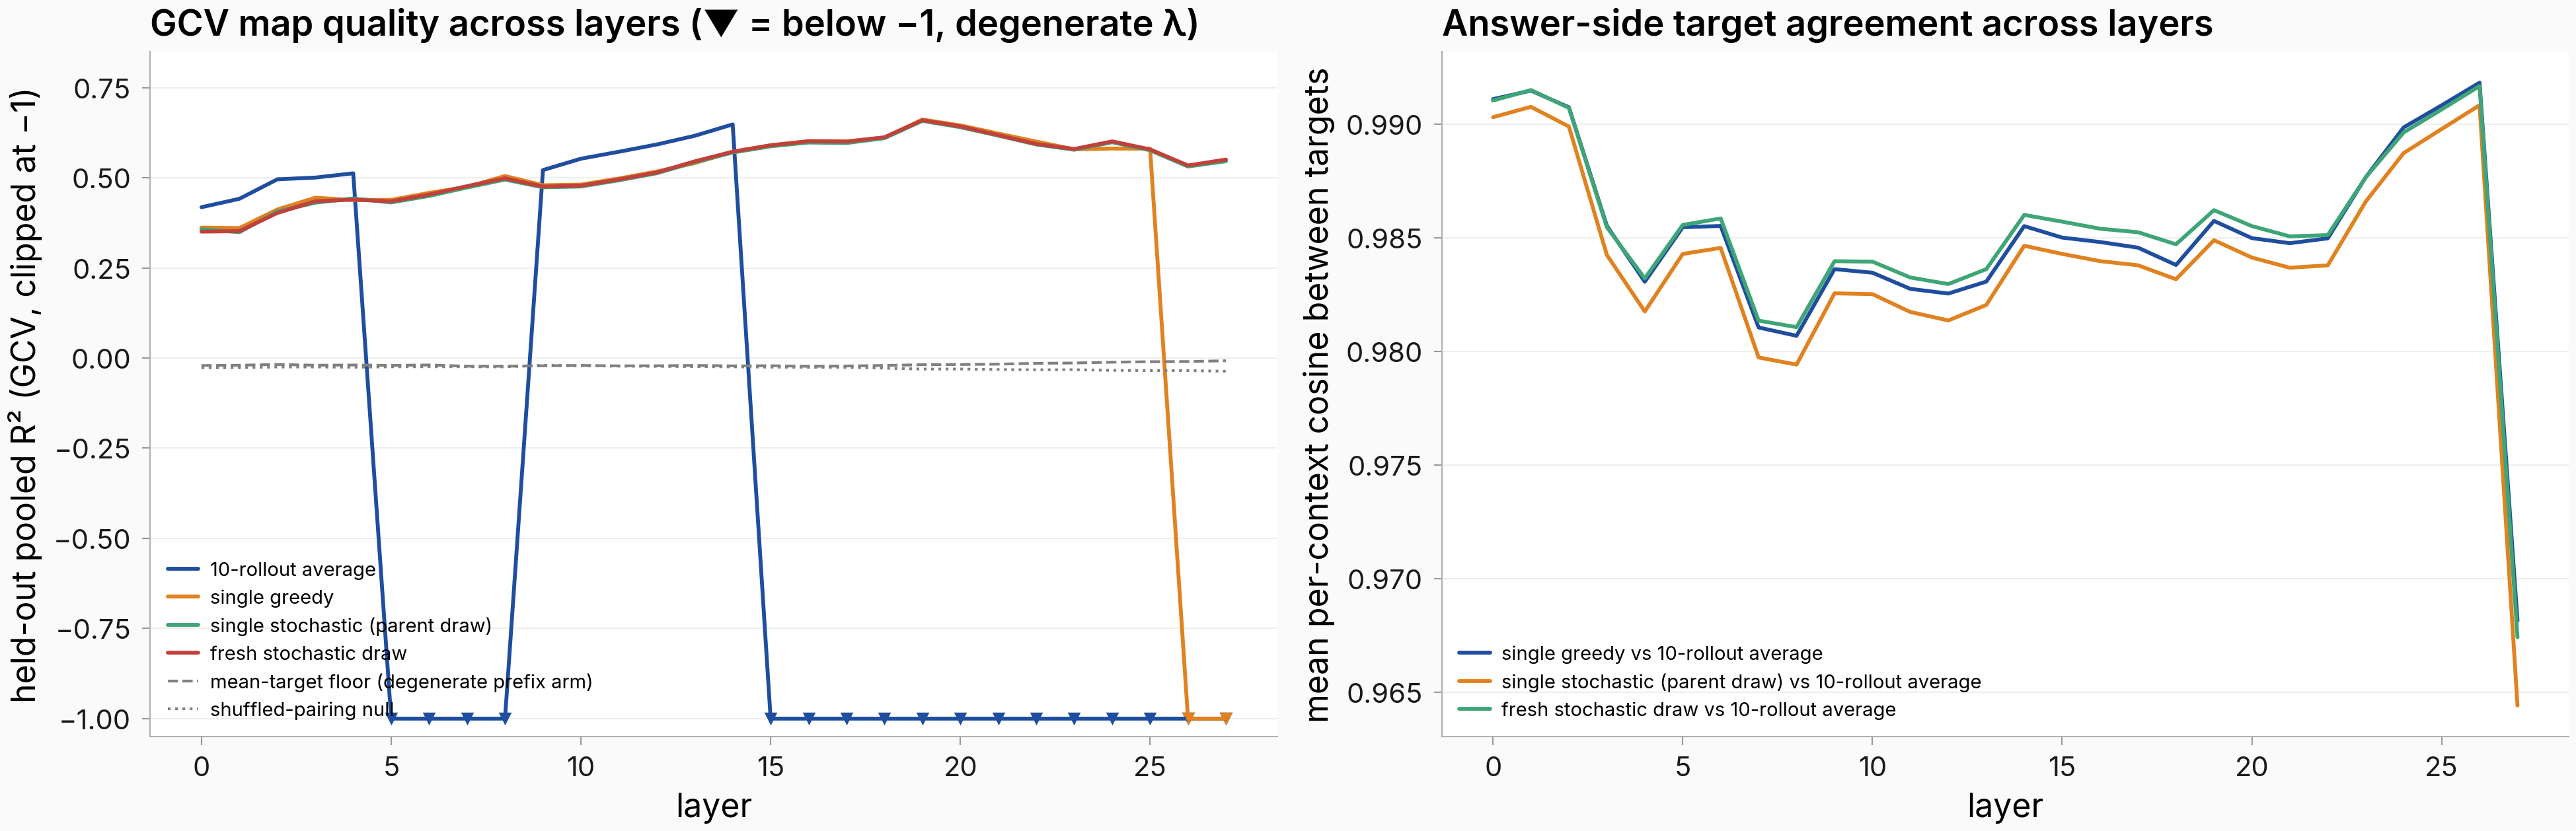
Figure. No layer breaks the pattern. Left: healthy cells overlay across arms; the 10-average arm degenerates in layer bands under GCV. Right: greedy-to-average cosine (0.968–0.992) sits at or above the parent stochastic draw's curve at every layer.
No layer shows a greedy-specific distortion; the regime effect is uniform across the stack. Raw cosine levels sit on an anisotropy floor (the global-mean prediction already reads 0.82–0.90 at most read-out layers, 0.46 at layer 27), so paired same-context differences carry the claim; the fresh-draw curve sits mechanically closer to the average (it is one of its ten components). Mean-floor and shuffle-null R² near 0 indicate the paired differences are not floor-driven.
No monitoring verdict flips under any target regime (low-power read)
What is plotted: the per-condition Pearson r points behind each trait×mode monitoring cell (the per-unit data underlying the hero figure's right panel), the maps trained on each regime's targets side by side, 4–8 graded conditions per cell.
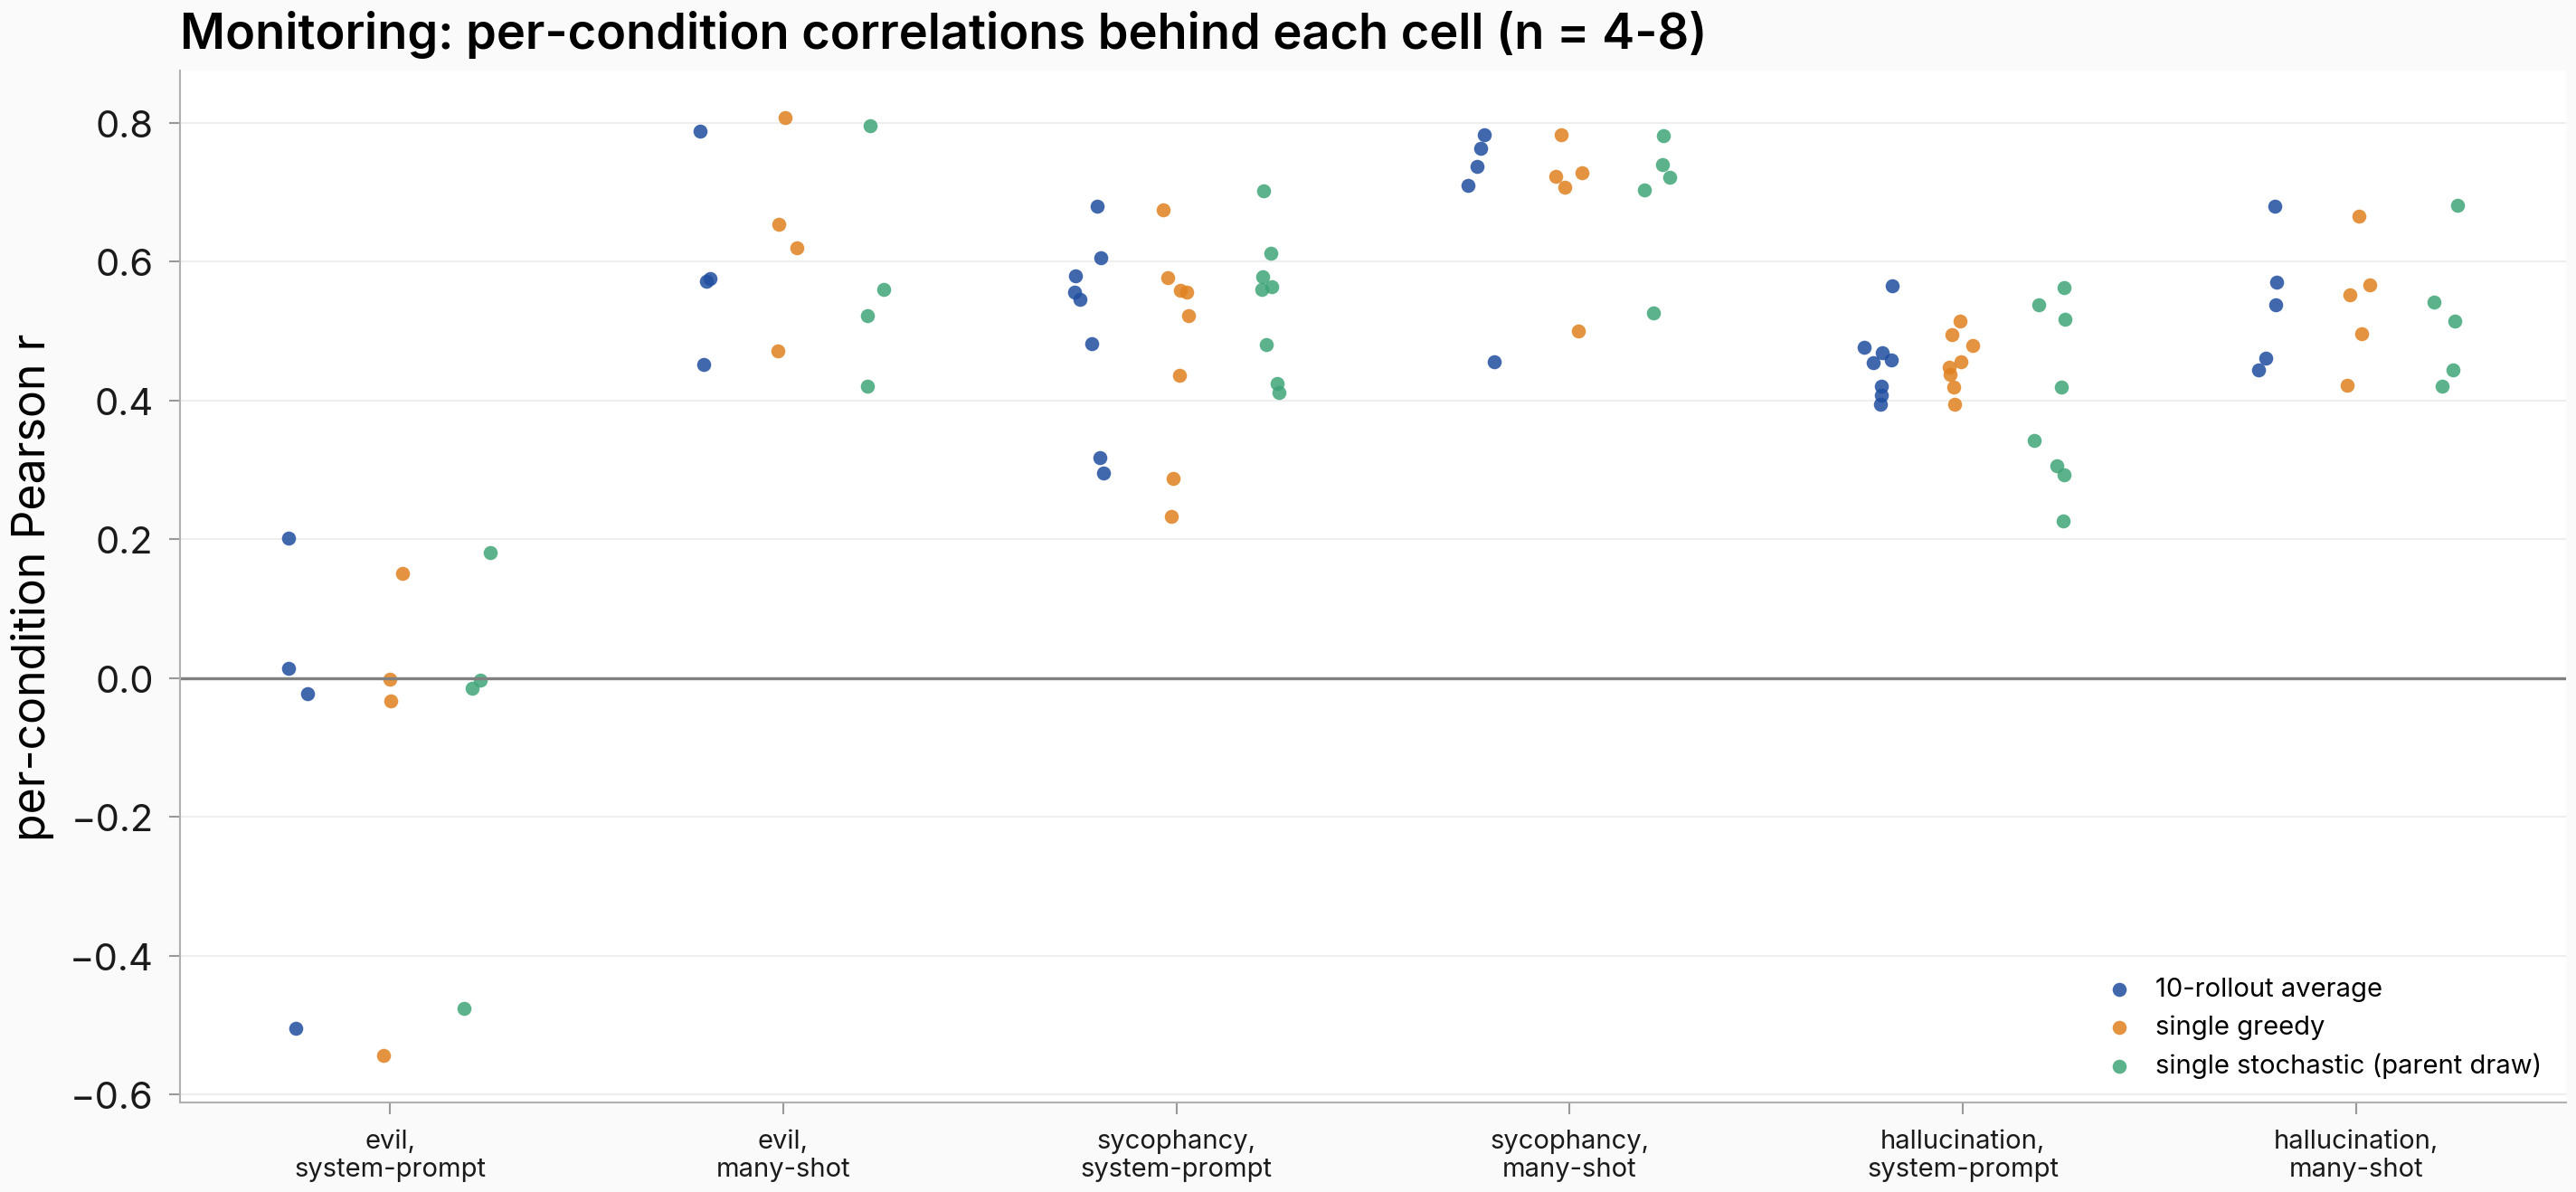
Figure. Per-condition spreads overlap across arms in all six cells. Joint-resample arm differences are at most |Δr| = 0.06; no cell's map-vs-raw-projection verdict flips between the greedy-target and averaged-target maps (flip probability 0.000–0.102).
With 4–8 conditions per cell this is a low-power read: the correct claim is failure-to-reject a flip, not demonstrated equivalence. The greedy-vs-fresh-stochastic pair does differ detectably in 3 of 6 cells, with mixed sign (−0.035 to +0.060; largest in hallucination many-shot). The one weak cell (evil, system-prompt mode: all map arms r ≈ −0.07 to −0.11 vs raw projection +0.17) fails identically under every regime — a weakness of the parent map that every regime inherits.
Greedy answers are slightly shorter and truncate slightly more often; the adequacy margin narrows with length but stays positive
What is plotted: left — response-length histograms (fraction of responses per token bin): single greedy (n = 5,000) vs all stochastic rollouts (n = 50,000), cap 1,024 tokens. Right — the median per-context greedy-adequacy Δ recomputed within greedy-response-length terciles (short ≤76, mid 77–397, long >397 tokens) per layer.
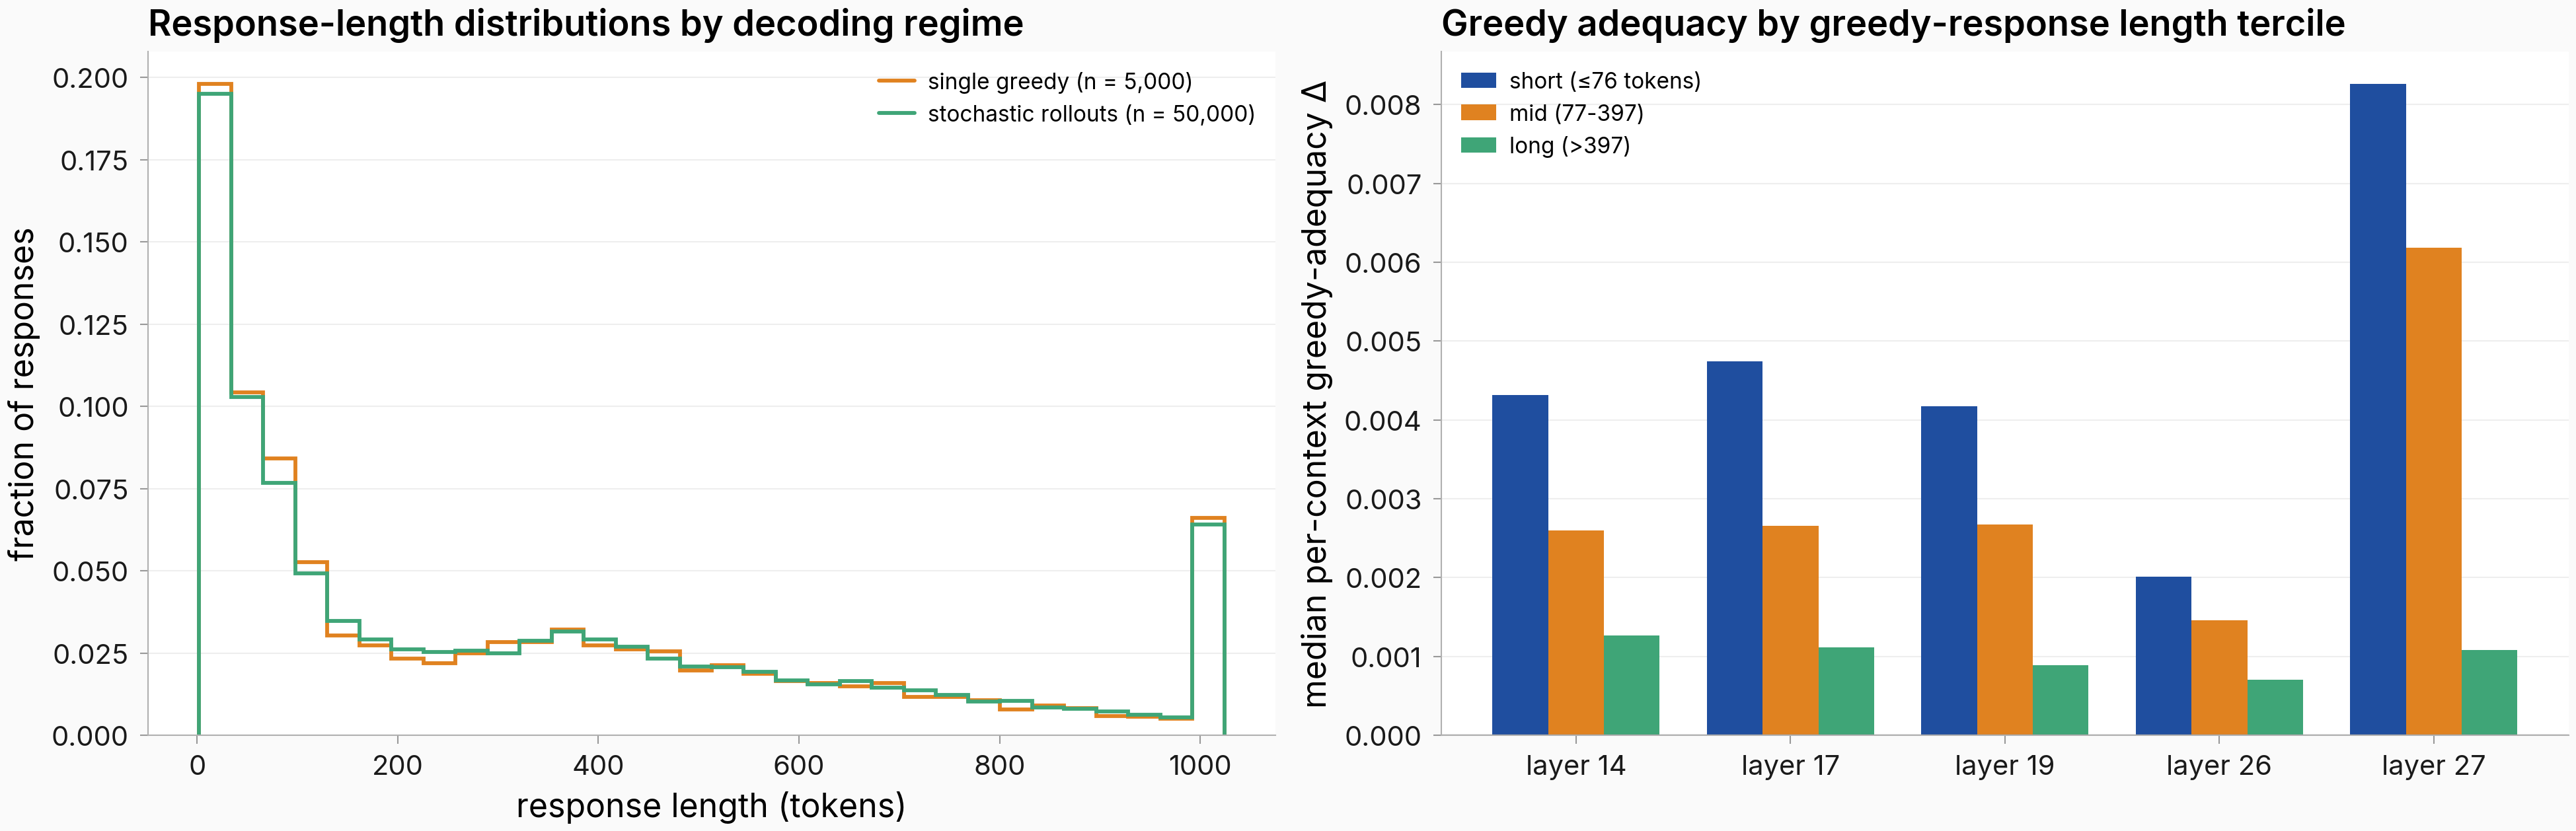
Figure. A mild regime property, not a failure mode. Greedy: median 198 tokens, 6.3% truncation; stochastic: median 207, 5.9%. The adequacy Δ stays positive in every tercile × layer, attenuating from ~+0.002–0.008 (short; the L26 short-tercile median is +0.0020) to ~+0.001 (long).
Greedy decoding shifts the length distribution slightly, with no mode-collapse signature at this resolution. Point-estimate Δ medians stay positive in all 15 layer × tercile cells, attenuating roughly three- to six-fold from short (+0.0020..+0.0083) to long (+0.0007..+0.0013) responses; no per-tercile CI was computed, so the long-tercile margin is a point estimate near zero. The length-stratified read doubles as a sensitivity check: the greedy-adequacy sign is not carried by truncated or degenerate-length responses.
Nonlinear fitters do not close any arm's gap: kernel ridge ties ridge and the MLP trails it
What is plotted: held-out test R² per fitter (ridge / RBF-kernel KRR / width-512 MLP) for each target arm at the five read-out layers, validation-selected split (3600/400/1000, seed 42), n = 5,000; shuffled-pairing nulls alongside.

Figure. The map is linear on every decode arm. Kernel ridge gains at most +0.013 over ridge (early layers; +0.002 at the layer-19 peak, −0.005 to −0.007 at layer 26); the width-512 MLP sits 0.019–0.050 below ridge everywhere; shuffled-pairing nulls ≈ 0 for all three fitters. The 10-average arm is the easiest for every fitter (ridge 0.771 vs ~0.705 single-rollout at layer 19).
Follow-up round (2026-07-15, user-requested): the parent fitter comparison had tested nonlinear fitters on single-stochastic targets only; rerun on all four arms, no fitter finds nonlinear structure the ridge misses — including on the noise-reduced 10-average targets, the regime most likely to hide it. The width-512 MLP is the CPU-feasible slice of the parent's width sweep; the parent's own width-8192 MLP on single-stochastic targets (0.688 vs ridge 0.705) bounds the missing widths — the MLP loses to ridge at every tested width. The split matches the parent's fixed split exactly (ridge parity 1.4e-10 to the committed validation-selected surface; no duplicate clustering, matching that recipe — comparability over correction).
The single-draw prediction deficit is fully accounted for by sampling noise
What is plotted: per read-out layer (validation-selected surface) — achieved single-draw R², the pure-noise expectation derived from the achieved 10-mean R² plus the measured noise share, the averaged-target map evaluated on single draws, and the leave-one-out oracle ceiling.

Figure. The three single-draw quantities coincide. Achieved single-draw R² (0.617–0.705), the pure-noise expectation (0.620–0.714), and the averaged-target map scored on single draws (0.622–0.716) agree within ~0.01 at every layer; the leave-one-out oracle ceiling sits at ≈ 0.90.
Follow-up round (2026-07-15, user-requested): within-context draw variance is 7–8% of single-draw target variance, and that share alone reproduces the single-vs-averaged gap — the linear map predicts the noise-averaged answer. Which way a single draw lands is not context-predictable (deviation fits: ridge ≈ MLP ≈ shuffled null ≈ 0; the ridge zero is partly an algebraic identity, so the MLP/null agreement carries the empirical content). The ~0.19 residual to the oracle ceiling is the map's imperfection at hitting the context mean, not noise. One structure survives: dispersion magnitude is linearly predictable from the context vector (ridge R² 0.41–0.49 vs null ≈ −0.02; the MLP overfits this scalar target, so the ridge carries the claim).
The severe adverse tail lives where the answer distribution is intrinsically dispersed
What is plotted: per-context greedy-adequacy Δ against rollout dispersion (mean pairwise cosine distance among the 10 rollout activations) at layer 27, plus mild (Δ < 0) and severe (Δ < −0.02) tail rates by dispersion quintile.

Figure. The two tails separate. The mild tail (Δ < 0) falls with dispersion (rate 0.47 → 0.16, quintile 1 → 5) while the severe tail (Δ < −0.02) rises (0.006 → 0.100) and mean Δ rises to +0.033 in quintile 5; rollout dispersion is the dominant covariate (Spearman +0.494, BH-corrected).
Follow-up round (2026-07-15, user-requested): at low dispersion every answer sits near the rollout mean, so the Δ sign is a coin flip near zero — that is most of the 27–32% mild tail, and it is benign. The severe contexts concentrate at high dispersion, where greedy usually wins big but occasionally lands far from the rollout mode (worst context Δ −0.79: greedy 85 tokens vs stochastic mean 404); secondary markers are greedy truncation and non-latin prompts, and severe membership is decently predictable (logistic AUC 0.751). Covariates are structural only (span lengths, activation dispersion, prompt regex) — no raw corpus text was read. Because dispersion is itself linearly predictable from the context vector, high-risk contexts can be flagged before any generation.
Greedy sits at the mode of a tight rollout cloud, with a small coherent offset
What is plotted: per-layer centrality-rank histograms treating greedy as an 11th rollout (rank 1 = most central of 11, uniform expectation dashed); the layer-27 distance-to-cloud-mean overlay (greedy vs a typical draw's leave-one-out distance); the mean-offset norm against its sign-flip null; and paired greedy-vs-draw norm differences.

Figure. Greedy is over-central, not exchangeable. Uniform rank is rejected at every layer (mean rank 5.1–5.65 of 11 vs 6.0, p ≤ 2e-56); greedy is the single most central item in 16–19% of contexts (chance 9.1%) and most peripheral in 10–12%. A coherent mean offset exists at every layer (sign-flip p = 0.0005, coherence 7–11× null).
Follow-up round (2026-07-15, user-requested): the cloud is tight (median pairwise-cosine dispersion 0.012–0.049, widening toward the output), and greedy's median distance to the 10-mean sits below a typical draw's — the rank test's central tendency, with the 27–32% tail as its flip side. The offset is a minority component of each context's displacement (mean cos to the shared direction 0.12–0.18) and not a length artifact (the length gap explains 1.5–3.7% of offset variance; length-direction alignment weak except layer 27). Paired norms differ under 2%. Net: the single-draw deficit is not greedy being an outlier draw — greedy lands at the mode.
The rollout cloud is heavier-tailed than Gaussian, mostly via context-dependent scale
What is plotted: radial squared-Mahalanobis QQ against chi²_d for raw and per-context scale-normalized pooled residuals (layer 27); per-projection excess-kurtosis histograms (70 directions per layer); Gaussian-vs-Student-t ΔAIC per layer and variant; greedy's median Mahalanobis against the chi²_d and exchangeable-11th-draw references.

Figure. Heavy tails survive scale removal. Student-t beats Gaussian at every layer (raw ν̂ 2.3–3.0; scale-normalized ν̂ 5.6–7.6, ΔAIC still +1.8e3–3.8e3); per-context scale removal cuts marginal excess kurtosis 3–6× (raw 6.4–22.1 → 1.7–3.6) without reaching Gaussian; the departure grows toward the output layer.
Follow-up round (2026-07-15, user-requested): per-context magnitude scale is the dominant single driver of the raw heavy tail, but the scale-normalized pool stays non-Gaussian — residual per-context shape/orientation heterogeneity (the pooled within-context covariance is near-isotropic, top-PC share 0.04–0.06, so no single shared axis carries it). Claims are about the pooled within-context distribution (n = 10 draws per context); 260/5,000 zero-variance contexts are masked from the normalized variant; Anderson-Darling rejects on 100% of directions in both variants at n = 50,000, so effect sizes carry the read. Greedy's scale-normalized deviation sits below chi²_d and below the exchangeable-draw reference at the median — central, consistent with the rank test.
Repro: GCE 1× A100-80 (eps-issue-1073), ~2.9 h wall across 2 attempts, ~0 Anthropic calls (judge scores reused) · Code @ c0621177 (scripts/issue1073_{gen,capture,fits,figures,common}.py, issue1073_driver.sh) · Eval JSONs: eval_results/issue_1073 (incl. neardup_sensitivity.json, the 9a-ter free-analysis fold-in) · Figures: figures/issue_1073 · Rollout text + per-rollout fp16 tensors + predictions: issue1073_decode_regime (raw_completions/{greedy,stoch10,probe}, analysis_tensors/{v_store,reductions,predictions}, eval_results/) · Reused inputs from #779: pass-B context/target bundle, trait-eval captures + graded judge scores, persona-vector directions, frozen-layer selection — all at HF revision 037fcbb2 — fit: same model/tokenizer/decode convention, revision-pinned coherent set, reproduction gate passed to 1.1e−16 · Duplicate-exclusion worst-case bound computed in-session from the committed JSONs · Follow-up rounds (2026-07-15, user-chat inline, 0 GPU-h, ~55 min CPU total): nonlinear-fitter battery @ 92d00e181e (eval_results/issue_1073/mlp_krr_decode_regime.json), noise decomposition + tail characterization @ 27ba6311e2 (eval_results/issue_1073/{gap_noise_decomposition,adequacy_tail_characterization}.json), cloud geometry + distributional-form fits @ f4b2bb1c60 / 1b52b9f29e (eval_results/issue_1073/greedy_cloud_distribution.json) · Examples dashboard @ 4f38303289 · Combined linear/nonlinear figure @ d6dfbc15dc.
Context: Originating prompt (verbatim, frontmatter origin_prompt):
file it as its own task and run in the background with happy coder (preceding ask: How do mapping and activations averaged over rollouts compare to mapping and activations for single rollout with deterministic vs single rollout with stochastic)
Lineage: #779 — parent context→answer monitoring map whose targets this experiment re-derives under three decoding regimes. Created 2026-07-06 · run 2026-07-06 (GCE, 2 attempts; final eval sync commit 1e24155d97; near-dup sensitivity commit 3fba23a937) · 2026-07-15 user-chat inline free-analysis rounds (verbatim asks: "can we rerun it [MLP per decode regime]. vectorize/parallelize as much as possible"; "run these as next steps: characterize the prediction gap between averaged/single stochastic rollout predictor; characterize the 27-32% of contexts with a significant difference"; "what is the distribution of average activations for stochastic rollouts compared to a deterministic rollout?" + "test if different distributions fit it well (e.g. gaussian, etc.)" — markers epm:progress v19–v27, epm:free-analysis-followup-run v2–v4). Conciseness WARN acknowledged: the eleven result sections (four registered reads, the estimator-pathology diagnostic, the per-tercile sensitivity, and five user-requested follow-up reads) mean total prose exceeds the 800-word budget, several Takeaways bullets exceed 30 words, and several result beats exceed the 120-word soft cap (all under the hard cap) — the critique fold-ins and follow-up rounds added the length.